Appendix A. Creation of an independent, non-autocorrelated, evaluation data set.
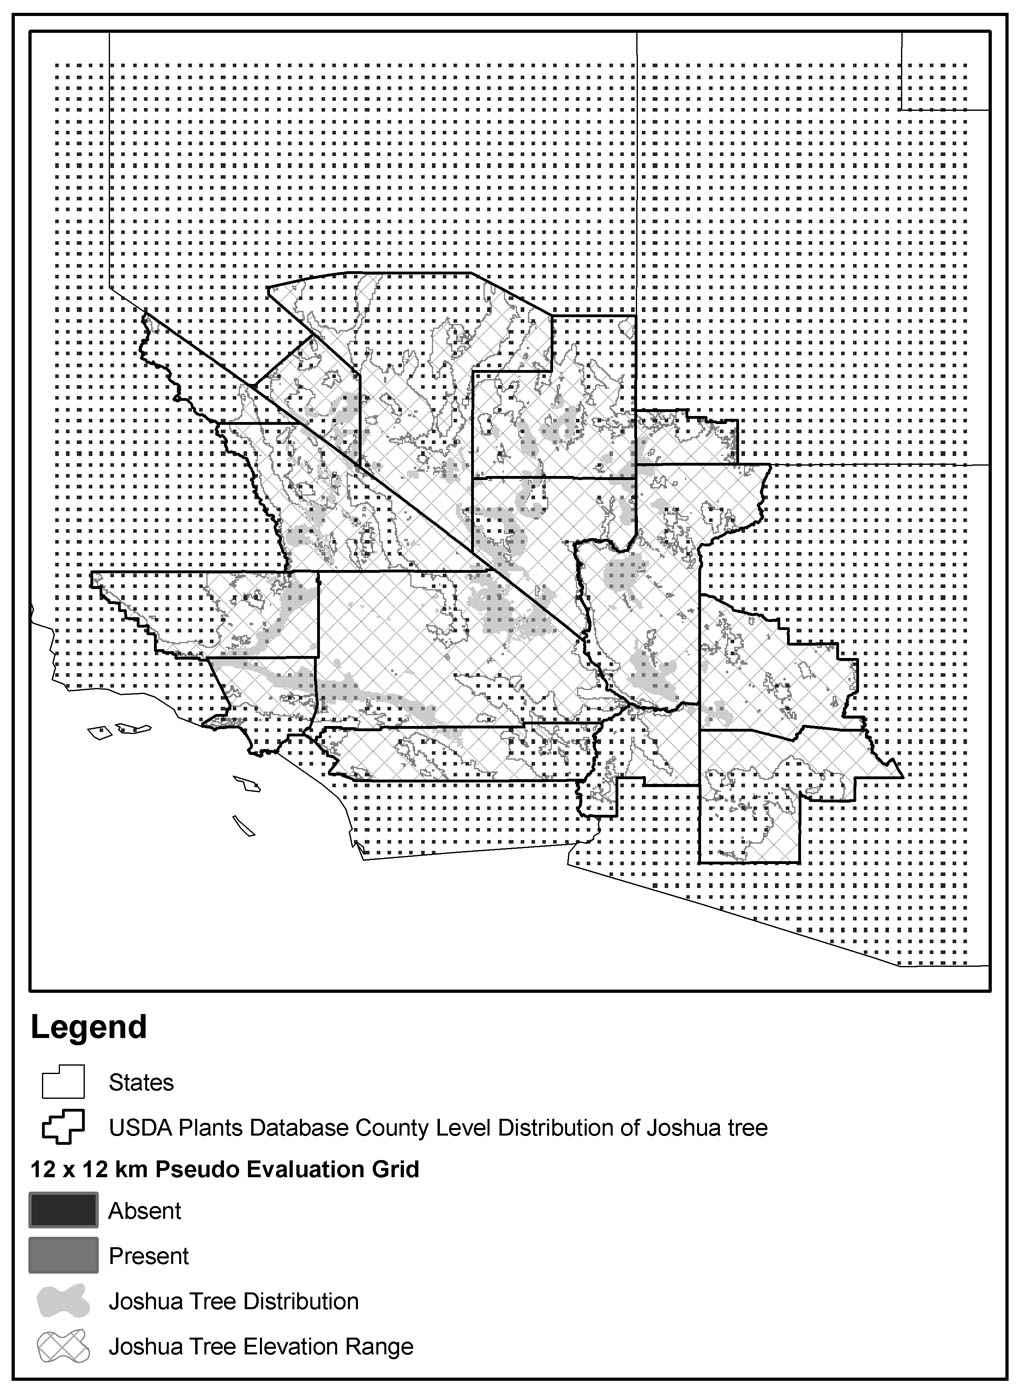
A model evaluation data set was created using sources independent of the training data. The suite of suitable climate models could not be evaluated by withholding a subset of the training data due to the high degree of spatial clustering of available plot data. Instead a pseudo- presence/absence gridded data set was created to evaluate model performance equally across the landscape. We designed a 12 km by 12 km grid and assigned points intersecting counties known to have Joshua tree absent according to the USDA Plants Database (USDA, NRCS, 2008) as absence locations (FIG. B1). Points within counties known to have Joshua tree present but are outside of the elevation range published in the Flora of North America (400 to 1800 m; eFloras, 2008) were also assigned absent. Presence locations were assigned for those intersecting a polygonal map of documented presence based upon the plot data and many additional sources (Cole et al. 2009; FIG. 2). Points falling within the correct elevational range and within counties known to contain Joshua tree, but outside of the polygonal presence map were eliminated from the analysis as being indeterminate (FIG. B1) as total absence is much more difficult to document than presence. These calculations generated a presence/absence data set containing 149 presence and 4354 absence locations. The training data set has a Moran's Index value of 0.21, while the evaluation data set has a Moran's Index value of 0.06. Though both scores suggest a high degree of spatial autocorrelation, the evaluation data set has a lower degree of spatial autocorrelation due to the point locations being more dispersed, leaving most of the spatial autocorrelation due to the natural clustering of Joshua tree occurrence across the landscape and removing the spatial autocorrelation that is a result of the tendency for sampling efforts to cluster plot data across the landscape (Goodchild 1986; Griffith 1987). The predictive abilities of each model could then be evaluated by the percentage of concordant and discordant pairs from among the 648,746 (149 × 4354) potential plot pairs. The suitable climate models with the highest percent of concordant pairs at both the ~1 km (30-arcsec) and ~4 km (2.5-arcmin) grid scales (Model #s 2 and 3; TABLE 1) were selected for further application to the future GCM results.
|
|
| FIG. B1. The 12 × 12 km grid of pseudo-absence (4354 points) and pseudo-presence (149 points) points constructed from the raw presence and absence data that was used to evaluate the suitable climate model predictions (TABLE 1). This grid allows for testing each model's predictions evenly across the Joshua tree range rather than just in those areas with abundant plot data. |
LITERATURE CITED
Goodchild, M. F. 1986. Spatial Autocorrelation. Catmog 47, Geo Books.
Griffith, D. 1987. Spatial Autocorrelation: A Primer. Resource Publications in Geography, Association of American geographers.
USDA, NRCS. 2008. The PLANTS Database (http://plants.usda.gov, 29 September 2008). National Plant Data Center, Baton Rouge, LA 70874-4490 USA.