Appendix C. The results of conditional, habitat-constrained randomizations.
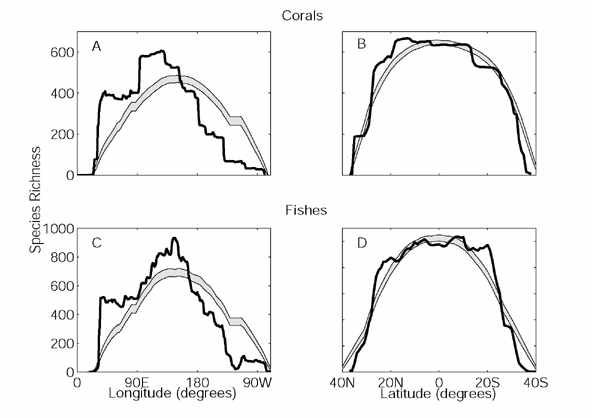
Fig. C.1. Observed longitudinal and latitudinal species richness patterns, plotted with predicted values under the mid-domain model. (A) Corals, longitude. (B) Corals, latitude. (C) Fishes, longitude. (D) Fishes, latitude. Shaded areas encompass 99% of the species richness values obtained from the randomizations (i.e., all but the lower and upper 0.5% of randomized species richness values). Compare with Fig. 2 in the text.
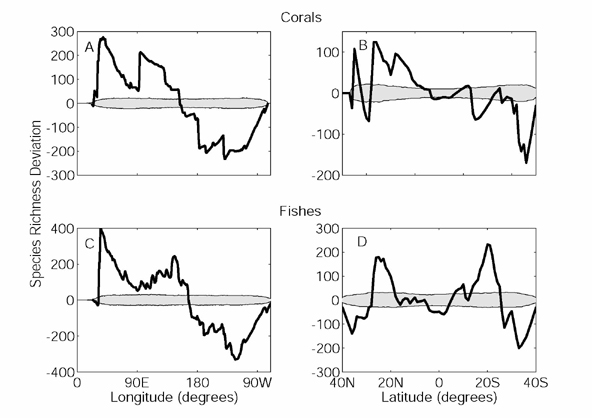
Fig. C.2. Observed longitudinal and latitudinal species richness patterns, expressed as deviations from species richness predicted by the mid-domain model. Shaded areas represent 99% confidence limits on the range of deviations expected by chance alone. (A) Corals, longitude. (B) Corals, latitude. (C) Fishes, longitude. (D) Fishes, latitude. Compare with Fig. 3 in the text.
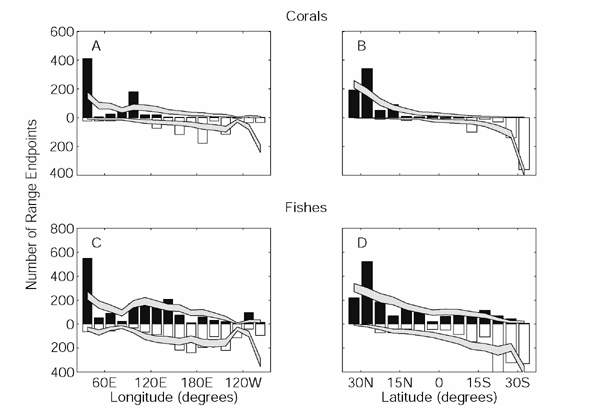
Fig. C.3. Observed distribution of range endpoints (bars), and expected distribution based on mid-domain randomizations (shaded region encompasses 99% of randomizations). (A) Corals, longitudinal limits. (B) Corals, latitudinal limits. (C) Fishes, longitudinal limits. (D) Fishes, latitudinal limits. Compare with Fig. 4 in the text.
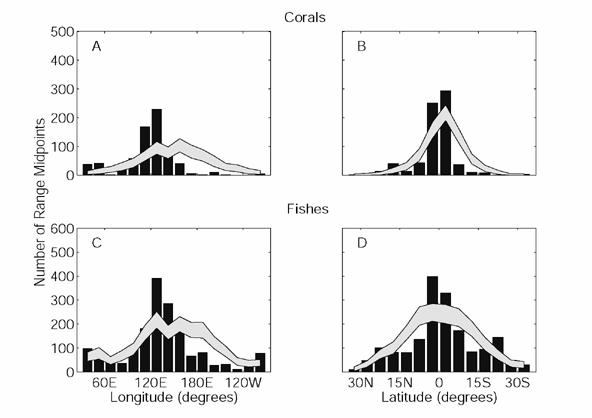
Fig. C.4. Observed distribution of range midpoints (bars), and expected distribution based on mid-domain randomizations (shaded region encompasses 99% of randomizations). (A) Corals, longitudinal midpoints. (B) Corals, latitudinal midpoints. (C) Fishes, longitudinal midpoints. (D) Fishes, latitudinal midpoints. Compare with Fig. 5 in the text.
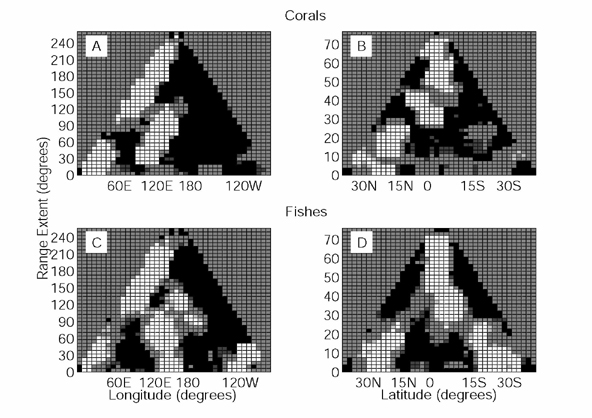
Fig. C.5. Midpoint deviation plots. Gray indicates midpoint densities whose values are within 99% of simulated midpoint densities. White and black indicates midpoint densities that are above and below these confidence limits, respectively. (A) Corals, longitude. (B) Corals, latitude. (C) Fishes, longitude. (D) Fishes, latitude. Compare with Fig. 6 in the text.