Appendix B. A figure and table showing spatiotemporal variation in survival.
![]() |
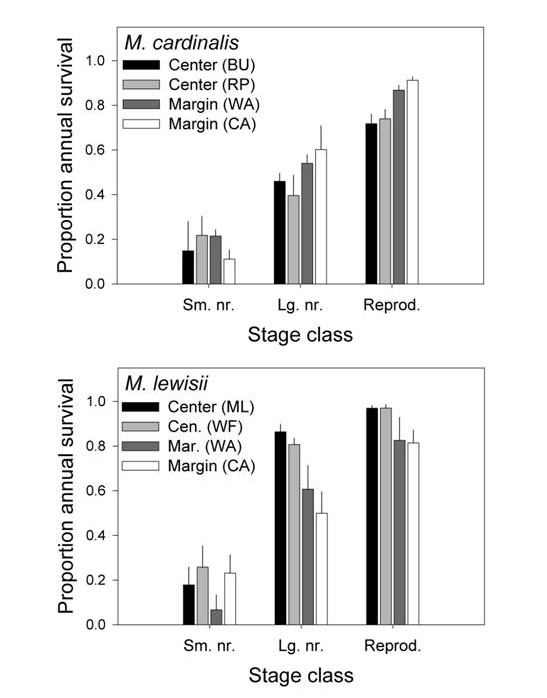
FIG. B.1. Spatial variation in proportion survival of each stage class for (a) M. cardinalis and (b) M. lewisii. Data presented are means (over all yearly transition intervals) + SE. Population abbreviations as follows: BU = Buck Meadows (830 m), RP = Rainbow Pool (833 m), WA = Wawona (1208 m), CA = Carlon (1320 m), ML = May Lake (2690 m), WF = Warren Fork (2750 m). Stage class abbreviations as follows: Sm. nr. = small non-reproductive, Lg. nr. = large non-reproductive, Reprod. = reproductive. |
TABLE B1. Generalized linear mixed models of the effects of range position, population within range position, and yearly transition interval on annual survival. Survival was modeled with a binomial distribution and a logit link function. F tests for fixed effects constructed by SAS GLIMMIX procedure. Z values for random effects obtained by dividing each variance estimate by its approximate standard error. No values remained significant after sequential Bonferroni adjustment to maintain table-wide Type I error of 0.05 for each species (Rice 1989).
Species |
Effects |
Small non-reproductive |
Large non-reproductive |
Reproductive |
|||||
M. cardinalis |
Fixed |
df |
dfD |
F |
P |
F |
P |
F |
P |
Position |
1 |
2 |
0.00 |
0.95 |
6.10 |
0.13 |
20.20 |
0.05 |
|
Year |
2 |
4 |
2.89 |
0.17 |
4.39 |
0.10 |
2.68 |
0.18 |
|
Position × year |
2 |
4 |
1.17 |
0.40 |
0.27 |
0.77 |
0.06 |
0.94 |
|
Random |
Estimate |
P |
Estimate |
P |
Estimate |
P |
|||
Population (position) |
1 |
— |
0.08 ± 0.33 |
0.41 |
0 |
0.01 ± 0.08 |
0.45 |
||
Population × year (position) |
1 |
— |
0.59 ± 0.54 |
0.13 |
0.13 ± 0.10 |
0.11 |
0.00 ± 0.12 |
0.50 |
|
M. lewisii |
Fixed |
F |
P |
F |
P |
F |
P |
||
Position |
1 |
1 |
0.47 |
0.56 |
13.32 |
0.07 |
19.53 |
0.05 |
|
Year |
2 |
2 |
3.67 |
0.12 |
0.91 |
0.47 |
1.14 |
0.41 |
|
Position × year |
2 |
2 |
17.06 |
0.01 |
0.02 |
0.98 |
0.66 |
0.56 |
|
Random |
Estimate |
P |
Estimate |
P |
Estimate |
P |
|||
Population (position) |
1 |
— |
0.90 ± 1.20 |
0.23 |
0.02 ± 0.21 |
0.47 |
0 |
||
Population × year (position) |
1 |
— |
0 |
0.27 ± 0.44 |
0.27 |
0.27 ± 0.40 |
0.25 |