Ecological Archives E096-128-D1
Daniel S. Falster, Remko A. Duursma, Masae I. Ishihara, Diego R. Barneche, Richard G. FitzJohn, Angelica Vårhammar, Masahiro Aiba, Makoto Ando, Niels Anten, Michael J. Aspinwall, Jennifer L. Baltzer, Christopher Baraloto, Michael Battaglia, John J. Battles, Ben Bond-Lamberty, Michiel van Breugel, James Camac, Yves Claveau, Lluís Coll, Masako Dannoura, Sylvain Delagrange, Jean-Christophe Domec, Farrah Fatemi, Wang Feng, Veronica Gargaglione, Yoshiaki Goto, Akio Hagihara, Jefferson S. Hall, Steve Hamilton, Degi Harja, Tsutom Hiura, Robert Holdaway, Lindsay B. Hutley, Tomoaki Ichie, Eric J. Jokela, Anu Kantola, Jeff W. G. Kelly, Tanaka Kenzo, David King, Brian D. Kloeppel, Takashi Kohyama, Akira Komiyama, Jean-Paul Laclau, Christopher H. Lusk, Douglas A. Maguire, Guerric le Maire, Annikki Mäkelä, Lars Markesteijn, John Marshall, Katherine McCulloh, Itsuo Miyata, Karel Mokany, Shigeta Mori, Randall W. Myster, Masahiro Nagano, Shawna L. Naidu, Yann Nouvellon, Anthony P. O'Grady, Kevin L. O'Hara, Toshiyuki Ohtsuka, Noriyuki Osada, Olusegun O. Osunkoya, Pablo Luis Peri, Any Mary Petritan, Lourens Poorter, Angelika Portsmuth, Catherine Potvin, Johannes Ransijn, Douglas Reid, Sabina C. Ribeiro, Scott D. Roberts, Rolando Rodríguez, Angela Saldaña-Acosta, Ignacio Santa-Regina, Kaichiro Sasa, N. Galia Selaya, Stephen C. Sillett, Frank Sterck, Kentaro Takagi, Takeshi Tange, Hiroyuki Tanouchi, David Tissue, Toru Umehara, Hajime Utsugi, Matthew A. Vadeboncoeur, Fernando Valladares, Petteri Vanninen, Jian R. Wang, Elizabeth Wenk, Richard Williams, Fabiano de Aquino Ximenes, Atsushi Yamaba, Toshihiro Yamada, Takuo Yamakura, Ruth D. Yanai, and Robert A. York. 2015. BAAD: a biomass and allometry database for woody plants. Ecology 96:1445. http://dx.doi.org/10.1890/14-1889.1
Author affiliations:
Daniel S. Falster1, Remko A. Duursma2, Masae I. Ishihara3, Diego R. Barneche1, Richard G. FitzJohn1, Angelica Vårhammar2, Masahiro Aiba4, Makoto Ando5, Niels Anten6, Michael J. Aspinwall2, Jennifer L. Baltzer7, Christopher Baraloto8, Michael Battaglia9, John J. Battles10, Ben Bond-Lamberty11, Michiel van Breugel12, James Camac1, Yves Claveau13, Lluís Coll14, Masako Dannoura15, Sylvain Delagrange16, Jean-Christophe Domec17, Farrah Fatemi18, Wang Feng19, Veronica Gargaglione20, Yoshiaki Goto21, Akio Hagihara22, Jefferson S. Hall23, Steve Hamilton24, Degi Harja25, Tsutom Hiura26, Robert Holdaway27, Lindsay B. Hutley28, Tomoaki Ichie29, Eric J. Jokela30, Anu Kantola31, Jeff W. G. Kelly32, Tanaka Kenzo33, David King34, Brian D. Kloeppel35, Takashi Kohyama36, Akira Komiyama37, Jean-Paul Laclau38, Christopher H. Lusk39, Douglas A. Maguire40, Guerric le Maire38, Annikki Mäkelä41, Lars Markesteijn42, John Marshall43, Katherine McCulloh44, Itsuo Miyata45, Karel Mokany46, Shigeta Mori47, Randall W. Myster48, Masahiro Nagano49, Shawna L. Naidu50, Yann Nouvellon51, Anthony P. O'Grady52, Kevin L. O'Hara10, Toshiyuki Ohtsuka53, Noriyuki Osada54, Olusegun O. Osunkoya55, Pablo Luis Peri56, Any Mary Petritan57, Lourens Poorter58, Angelika Portsmuth59, Catherine Potvin60, Johannes Ransijn61, Douglas Reid62, Sabina C. Ribeiro63, Scott D. Roberts64, Rolando Rodríguez65, Angela Saldaña-Acosta66, Ignacio Santa-Regina67, Kaichiro Sasa68, N. Galia Selaya69, Stephen C. Sillett70, Frank Sterck71, Kentaro Takagi72, Takeshi Tange73, Hiroyuki Tanouchi74, David Tissue2, Toru Umehara75, Hajime Utsugi21, Matthew A. Vadeboncoeur76, Fernando Valladares77, Petteri Vanninen78, Jian R. Wang79, Elizabeth Wenk1, Richard Williams80, Fabiano de Aquino Ximenes81, Atsushi Yamaba82, Toshihiro Yamada83, Takuo Yamakura84, Ruth D. Yanai85, Robert A. York86
1 Biological Sciences, Macquarie University NSW 2109, Australia
2 Hawkesbury Insitute for the Environment, University of Western Sydney, Hawkesbury Campus, First Floor, Building L9, Locked Bag 1797, Penrith NSW 2751, Australia
3 Graduate School for International Development and Cooperation, Hiroshima University, 1-5-1 Kagamiyama, Higashi-Hiroshima 739-8529, Japan
4 Graduate School of Life Sciences, Tohoku University, 6-3 Aoba, Aramaki, Aoba-ku,Sendai 980-8578, Japan
5 Field Science Education and Research Center, Kyoto University, Oiwake-cho, Kitashirakawa, Sakyo-ku, Kyoto, 606-8502, Japan
6 Centre for Crop Systems Analysis, Wageningen UR, The Netherlands
7 Biology Department, Wilfrid Laurier University, 75 University Avenue West, Waterloo, Ontario, N2L 3C5, Canada
8 INRA, UMR Ecologie des Forêts de Guyane, Kourou, French Guiana
9 CSIRO Agriculture Flagship, Private Bag 12, Hobart 7001, Australia
10 Dept of Environmental Science, Policy, & Management, University of California, Berkeley, CA 94720, USA
11 Joint Global Change Research Institute, 5825 University Research Court, Suite 3500, College Park, MD 20740, USA
12 Yale-NUS College, 6 College Avenue East, Singapore 138614; Smithsonian Tropical Research Institute, Panama
13 Departement des sciences biologiques, Universite du Quebec a Montreal, QC, H3C 3P8, Canada
14 Forest Sciences Centre of Catalonia (CTFC), Ctra. Sant Llorenç de Morunys, km 2, 25280, Solsona, Spain
15 Ecosystem Production and Dynamics, Department of Natural Resources, Graduate School of Global Enviromental Studies, Kyoto University, Yoshida-honmachi, Sakyo-ku, Kyoto 606-8051 Japan; Forest Utilization Lab. Division of Forest and Biomaterial Science, Graduate School of Agriculture, Kyoto University, Kitashirakawa-oiwakecho, Sakyo-ku, Kyoto 606-8502, Japan
16 Departement des sciences naturelles, Universite du Quebec en Outaouais, Institut des Sciences de la Forêt Tempérée (ISFORT), 58 rue principal, Ripon (Quebec) J0V 1V0, Canada
17 Bordeaux Sciences Agro, INRA ISPA UMR 1391, F‒33175, Gradignan, France
18 Environmental Studies Program, St. Michael's College, St. Edmund's Hall Room 325, St. Michael's College, One Winooski Park, Colchester, Vermont, 05439, USA
19 Institute of Desertification Studies, Chinese Academy of Forestry, Beijing, 100091, China
20 Instituto Nacional de Tecnología Agropecuaria and Universidad Nacional de la Patagonia Austral, casilla de correo 332 CP 9400, Argentina
21 Forestry and Forest Products Research Institute (FFPRI), 1 Matsunosato, Tsukuba, Ibaraki, 305-8687, Japan
22 Laboratory of Ecology and Systematics, Faculty of Science, University of the Ryukyus, Okinawa 903-0213 Japan
23 Smithsonian Tropical Research Institute, Panama
24 Hamilton Environmental Service, 2345 Benalla-Tatong Road, Tatong VIC 3673, Australia
25 Southeast Asia Regional Program, World Agroforestry Centre (ICRAF), Jalan CIFOR, Situ Gede, Sindang Barang, Bogor, 16115, Jawa Barat, Indonesia
26 Tomakomai Research Station, Field Science Center for Northern Biosphere, Hokkaido University, Takaoka, Tomakomai, 053-0035, Japan
27 Landcare Research, P.O. Box 69040, Lincoln 7640, New Zealand
28 School of Environmental and Life Sciences, Charles Darwin University, Darwin NT 0909, Australia
29 Faculty of Agriculture, Kochi University, Nankoku, 783-8502, Japan
30 UF IFAS School of Forest Resources and Conservation, University of Florida, P.O. Box 110410, Gainesville, FL 32611-0410, USA
31 The Finnish Forest Research Institute, P.O. Box 18 (Jokiniemenkuja 1), FI-01301 Vantaa, Finland
32 School of Forest Science and Management, Dept. of Renewable Resources, University of Alberta, 4-29 Earth Sciences Building, Edmonton, Alberta T6G 2E3, Canada
33 Bureau of International Partnership, Forestry and Forest Products Research Institute, Tsukuba, Ibaraki, 305-8687, Japan
34 Forest Ecosystems and Society, Oregon State University, Corvallis, OR, USA
35 Department of Geosciences and Natural Resources, Western Carolina University, 331 Stillwell Building, Cullowhee, NC 28723, USA
36 Faculty of Environmental Earth Science, Hokkaido University, Kita-ku, Sapporo 060-0810, Japan
37 Faculty of Applied Biological Sciences, Gifu University, 1-1 Yanagido, Gifu, 501-1193, Japan
38 CIRAD, UMR Eco&Sols, 2 Place Viala - bat 12, 34060 Montpellier Cedex 02, France
39 School of Science, University of Waikato, Private 3105, Hamilton, New Zealand
40 Department of Forest Engineering, Resources and Management, Oregon State University, Corvallis OR 97331-5752, USA
41 Department of Forest Sciences, P.O.Box 27 (Latokartanonkaari 7), 00014 University of Helsinki, Finland
42 Department of Zoology, University of Oxford, South Parks Road, Oxford OX1, 3PS, UK
43 Swedish Agricultural University, Department of Forest Ecology and Management, Skogmarksgränd, 90736 Umeå, Sweden
44 Department of Botany, University of Wisconsin-Madison, 430 Lincoln Dr, Madison, WI 53706, USA
45 Kyushu University, 6-10-1, Hakozaki, Higashi, Fukuoka, 812-8581, Japan (present address: 436-8, Nishiikumacho, Matsue, Shimane, 690-0865, Japan)
46 CSIRO Land and Water Flagship, Black Mountain Laboratories, Clunies Ross Street, Black Mountain ACT 2601, Australia
47 Yamagata Univeristy, Wakaba-machi 1-23, Tusruoka-shi, Yamagata-ken, 997-8555, Japan
48 Biology Department, OSU-OKC, 900 N Portland Ave., Oklahoma City, OK 73107-6195, USA
49 Osaka City University, 3-3-138 Sugimoto, Sumiyoshi-ku, Osaka 558-8585, Japan (present address: Higashigaoka 808-638, Kishiwada, Osaka, 596-0807, Japan)
50 University of Illinois at Urbana-Champaign, 127 Burrill Hall MC-120, 407 S. Goodwin Ave., Urbana IL, 61821
51 Departamento de Ciencias Atmosfericas, IAG, Universidade de Sao Paulo, Rua do Matao, 1226, Cidade Universitaria, Sao Paulo, SP, Cep 05508-900, Brazil
52 CSIRO Land and Water Flagship, Private Bag 12, Hobart Tasmania 7009, Australia
53 Institute for Basin Ecosystem Studies, Gifu University, Yanagito 1-1, Gifu, Gifu, 501-1193, Japan
54 Tomakomai Research Station, Field Science Center for Northern Biosphere, Hokkaido University, Tomakomai 053-0035, Japan
55 College of Marine and Environmental Sciences, James Cook University, P.O. Box 6811, Cairns Queensland 4870, Australia
56 INTA-UNPA-CONICET, CC 332 (9400), Rio Gallegos, Santa Cruz, Argentina
57 Department of Silviculture and Forest Ecology of the Temperate Zones, Georg-August University Gottingen, Bosgenweg 1, 37077, Gottingen, Germany
58 Forest Ecology and Forest Management group, Wageningen University, P.O. Box 47, 6700 AA Wageningen, The Netherlands
59 Institute of Ecology, Tallinn University, Uus-Sadama 5, Tallinn 10120, Estonia
60 Department of Biology, McGill University, Montreal, Quebec, Canada
61 Department of Geosciences and Natural Resource Management, University of Copenhagen, Denmark; Department of Disturbance Ecology, University of Bayreuth, Germany
62 Centre for Northern Forest Ecosystem Research, Ontario Ministry of Natural Resources, 955 Oliver Road, Thunder Bay, Ontario P7B 5E1, Canada
63 Universidade Federal do Acre, Centro de Ciências Biológicas e da Natureza, Curso de Engenharia Florestal, 69920-900 Rio Branco (AC), Brazil
64 Department of Forestry, Mississippi State University, Mississippi State, MS 39762-9681, USA
65 Facultad Ciencias Forestales, Universidad de Concepción. Victoria 631, Barrio Universitario, Concepción, Región del Biobío, Chile
66 Facultad de Ciencias Universidad Nacional Autanoma de Mexico, Mexico
67 Institute of Natural Resources and Agrobiology of Salamanca, IRNASA-CSIC, Spain
68 Field Science Center for Northern Biosphere, Hokkaido University, Kita11, Nishi10, Kita-ku, Sapporo, Hokkaido, 060-0811, Japan
69 PROMAB: Programa de Manejo de Bosques de la Amazonia Boliviana, Riberalta, Bolivia
70 Department of Forestry and Wildland Resources, Humboldt State University, Arcata CA 95521, USA
71 Centre for Ecosystem Studies, Forest Ecology and Forest Management Group, Wageningen University and Research Centre, P.O. Box 47, 6700 AA, Wageningen, The Netherlands
72 Teshio Experimental Forest, Field Science Center for Northern Biosphere, Hokkaido University, Horonobe, 098-2943, Japan
73 Graduate School of Agricultural and Life Sciences, The University of Tokyo, 1-1-1 Yayoi, Bunkyo-ku, Tokyo, 113-8657, Japan
74 Hokkaido Research Center, Forestry and Forest Products Research Institute (FFPRI), Hitsujigaoka-7, Toyohira, Sapporo, Hokkaido, 062-8516, Japan
75 Graduate School of Landscape Design and Management, University of Hyogo, 954-2, Nojimatokiwa, Awaji City, 656-1726, Japan
76 Earth Systems Research Center, University of New Hampshire, 8 College Road, Durham, NH 03824, USA
77 Museo Nacional de Ciencias Naturales CSIC, Serrano 115 dpdo.E-28006 Madrid, Spain
78 School of Applied Educational Science and Teacher Education, University of Eastern Finland, Box 86, 57101 Savonlinna, Finland
79 Faculty of Natural Resources Management, Lakehead University, Thunder Bay, ON P7B 5E1, Canada
80 CSIRO Ecosystem Sciences - Darwin, 564 Vanderlin Drive, Berrimah NT 0828, Australia
81 NSW Department of Primary Industries, West Pennant Hills, NSW, Australia
82 Forestry Research Center, Hiroshima Prefectural Technology Research Institute, 4-6-1, Toukaichi-higashi, Miyoshi, Hiroshima, 728-0013, Japan
83 Graduate School of Integrated Arts and Sciences, Hiroshima University, Higashi-Hiroshima 739-8521 Japan
84 Graduate School of Science, Osaka City University, Sugimoto 3-3-138, Sumiyoshi, Osaka 558-8585, Japan
85 State University of New York, College of Environmental Science and Forestry, 210 Marshall Hall, 1 Forestry Drive, Syracuse NY 13210, USA
86 University of California Berkeley, Center for Forestry, 4501 Blodgett Forest Road, Georgetown CA 95634, USA
Quantifying the amount of mass or energy invested in plant tissues is of fundamental interest across a range of disciplines, including ecology, forestry, ecosystem science, and climate change science (Niklas, 1994; Chave, Andalo, Brown, et al., 2005; Falster, Brännström, Dieckmann, et al., 2010). The allocation of net primary production into different plant components is an important process affecting the lifetime of carbon in ecosystems, and resource use and productivity by plants (Cannell and Dewar, 1994; Litton, Raich, and Ryan, 2007; Poorter, Niklas, Reich, et al., 2012). While many scientific studies have destructively harvested woody plants, most of the data collected have only been made available in the form of summary tables or figures included in publications. Until now, the raw data has resided piecemeal on the hard drives of individual scientists spread around the world. Several studies have gathered together the fitted (allometric) equations for separate data sets (Ter-Mikaelian and Korzukhin, 1997; Jenkins, Chojnacky, Heath, et al., 2003; Zianis, Muukkonen, Mäkipää, et al., 2005; Henry, Bombelli, Trotta, et al., 2013), but none have previously attempted to organize and share the raw individual plant data underpinning these equations on a large scale. Gathered together, such data would represent an important resource for the community, meeting a widely recognized need for rich, open data resources to solve ecological problems (Costello, Michener, Gahegan, et al., 2013a; Fady, Benard, Pichot, et al., 2014; Harfoot and Roberts, 2014).
We (D. S. Falster and R. A. Duursma, with the help of D. R. Barneche, R. G. FitzJohn and A. Vårhammar) set out to create such a resource. We identified data sources from existing collaborations as well as a wide-ranging literature search, focussed on woody plants in field as well as controlled conditions. We constrained the search by including only data where a wide range in plant sizes was measured, as well as a set of minimum variables (plant height and leaf mass or area), and an emphasis on field-grown plants (nearly all data from plants grown in controlled conditions arose from existing collaborations). We do not claim to have done an exhaustive search of the literature, due to the very large number of potential studies that could be included. In each case we asked authors directly whether they would be willing to make their raw data files freely available. The response was overwhelming: nearly everyone we contacted was interested to contribute their raw data. Moreover, we were invited to incorporate another compilation led by M. I. Ishihara and focusing on Japanese literature (Ishihara, Utsugi, Tanouchi, et al., 2015). As a result, we present BAAD: a Biomass And Allometry Database for woody plants, comprising data collected in 176 different published and unpublished studies (Fig. 1).
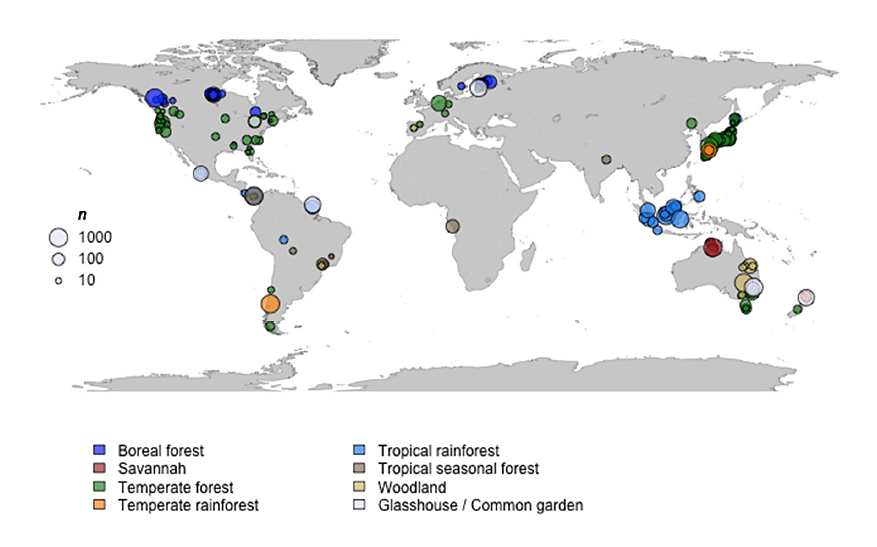
Fig. 1. Global distribution of studies included in the BAAD. Symbols are sized relative to the number of individual plants in each data set.
Combining data from many different studies, each using its own set of terms and units, and quirks, is no trivial task (Michener, Brunt, Helly, et al., 1997; Michener and Jones, 2012; Kratz and Strasser, 2014). This compilation would not have been possible without several new technologies. In particular,
- Our entire work flow is scripted, using the R computing environment. The database can be rebuilt in an instant from the raw data files, using a single command. When a single data contribution has been modified, the final master dataset is thus easily recreated.
- We minimised the amount of code by requiring each study to conform to a common format, with separate files for raw data, units of data, meta data, contact details, and citation (see examples in attached code). These files were then processed in a standardized way (Fig. 2).
- We used the package
knitr within R to automatically produce reports comparing the raw data provided by a single study to the rest of the database (Xie, 2014a; Xie, 2013; Xie, 2014b). These reports were sent to data contributors for verification, and thus allowed for easy identification of errors in the raw data or processing. Each report included plots for every pairwise combination of quantitative variables in a given study, site maps, and metadata. The updated reports are available on the database website.
- We used version control and the code sharing website github to track the evolution of the database and the code to process the raw data. Datasets as well as processing methods inevitably contain errors. With version control, we are able to trace these errors to the source, and review review the history of changes to any given data set.
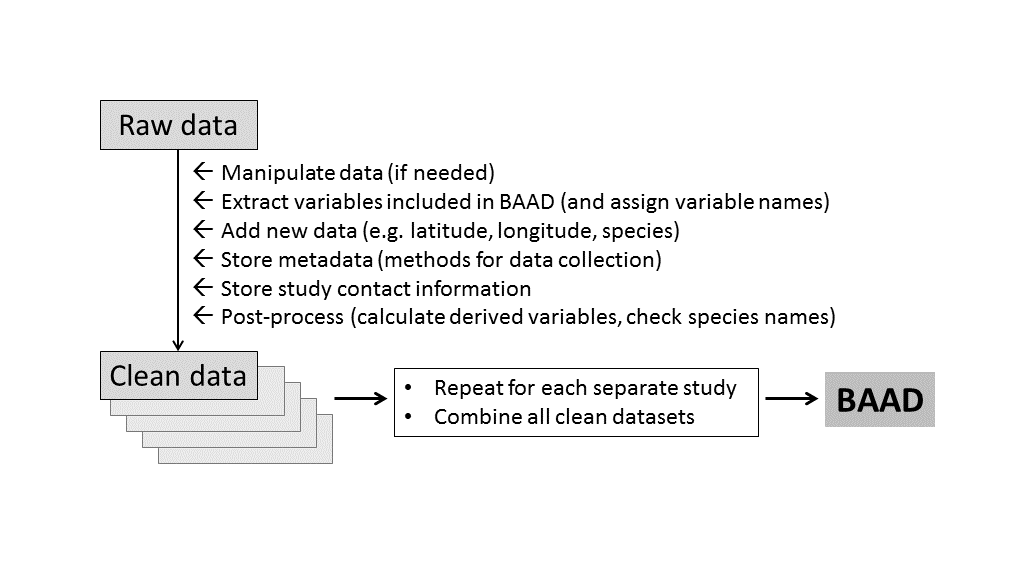
Fig. 2. Workflow for building the BAAD. Data from each study is processed in the same way, using a standardised set of input files, resulting in a single data set with a common format.
Until recently, most scientific publications in biology have mostly been concerned with small data (Noorden, 2013). Data sets arrive in small parcels, corresponding to the work of an individual study, or perhaps a handful of studies. It is exciting to be able to put these parcels together, to create something larger. We hope others will use this data set and build on it. See github.com/dfalster/baad for information on how to contribute to future releases.
METHODS
Abe1981
Data from: Abe N (1981). Studies on the management of Abies sachalinensis Mast. planted forest (III) On biomass estimation of 53-year-old stand. Bulletin of the Hokkaido Forest Experiment Station, 19, pp. 115-127.
- Site Description
- Site(s) type(s): Boreal forest
- Geography
- latitude, longitude: 45, 143
- Site(s) history: plant grown in plantation managed
- Experimental or sampling design
- Design characteristics: In August 1979, 17 sample trees in a quadrate (15 m times 10 m) of a 53 year-old plantation were cut down (Abe 1980). The stand was facing the north-east with slope of 13 to 20 degree. Five trees were selected to represent each diameter class. These five trees were then treated with the stratified clip technique by cutting them into parts contained in horizontal layers of 0-0.3 m, 0.3-1.3 m, and at intervals of 1 m upward to the crown base and in horizontal strata defined by whorl brahces from crown base to the stem apex. For the remaining 12 tress, stems were cut into parts contained in horizontal layer or 0-0.3 m, 0.3-1.3 m, and at intervals of 3.65 m upward to the crown base, and in horizontal strata defined by whorl brahces from crown base to the stem apex.
- Variables included: a.stba, a.stbh, a.stbc, h.t, h.c, d.ba, d.bh, h.bh, c.d, m.lf, m.st, m.so, m.br
- Species sampled: Abies sachalinensis
- Research methods
- Stem cross sectional area: Estimated from stem diameter.
- Height: Metadata not available.
- Biomass: For stem biomass, fresh mass was converted to dry mass from the ratio of dry to fresh mass. The ratio was estimated from subsamples taken from each tree at each layer. For branch and leaf biomass, total fresh mass of branches and leaves were converted to dry mass from the ratio of dry to fresh mass. Then, dry mass of branches and leaves were converted to branch dry mass and leaf dry mass by the ratio of leaf to branch dry mass. Both ratios were estimated from subsamples taken from each tree at each whorl stratum. All samples were oven-dried at 90 degrees C for 96 hours.
- Other variables: M.I. Ishihara, H. Utsugi, H. Tanouchi, and T. Hiura conducted formal search of reference databases and digitized raw data from Abe (1980). Based on this reference, meta data was also created by M.I. Ishihara. Species name and family names were converted by M.I. Ishihara according to the following references: Satake Y, Hara H (1989a) Wild flower of Japan Woody plants I (in Japanese). Heibonsha, Tokyo; Satake Y, Hara H (1989b) Wild flower of Japan Woody plants II (in Japanese). Heibonsha, Tokyo.
- Study contacts: Masae I. Ishihara, Hajime Utsugi, Hiroyuki Tanouchi, Tsutom Hiura
Aiba2005
Data from: Aiba M and Nakashizuka T (2005). Sapling structure and regeneration strategy in 18 Shorea species co-occurring in a tropical rainforest. Annals of Botany, 96(2), pp. 313-321. DOI: 10.1093/aob/mci179.
- Site Description
- Site(s) type(s): Tropical rainforest
- Geography
- latitude, longitude: 4.03, 113.83
- Site(s) history: plant grown in field wild
- Experimental or sampling design
- Design characteristics: Of the approx. 70 species of the genus Shorea that occur in Lambir Hills National Park (Sarawak, Malaysia), 18 species, for which enough saplings of a comparable size could be collected, were analysed - 360 individuals were analysed. In August 2003, approx. 20 sound saplings of various sizes (0.1-1.5m tall) of each species were sampled to determine their allometric relationships. All sampled individuals grew under closed canopies. For S. ochracea, only 18 individuals were sampled because of its rarity. Also sampled were 10-15 saplings of each species excluding S. ochracea, in November 2003.
- Variables included: status, a.lf, a.stba, a.cp, h.t, h.c, d.ba, d.cr, c.d, m.lf, m.st, m.so, m.br, m.rt, m.to, a.ilf
- Species sampled: Shorea acuta, Shorea agami, Shorea andulensis, Shorea beccariana, Shorea biawak, Shorea bracteata, Shorea crassa, Shorea curtisii, Shorea exelliptica, Shorea falciferoides, Shorea laxa, Shorea macroptera, Shorea ochlacea, Shorea ovalis, Shorea ovata, Shorea pilosa, Shorea scrobiculata, Shorea smithiana
- Research methods
- Leaf area: For each sapling, the total leaf area and maximum individual leaf area were measured using the software LIA32 for Windows 95 (K. Yamamoto) after scanning the images.
- Stem cross sectional area: Stem diameter was measured at ground using calliper at right angles.
- Height: Height was measured as the vertical distance from the ground to the highest apex.
- Crown area: Crown width was measured at right angles including the widest width. Projected area was estimated by assuming an ellipse.
- Biomass: Saplings were divided into root, stem, branches and leaf lamina. Each compartment was dried to constant weight and weighed. Leaf petioles were not included in Total leaf mass. All parts of the saplings were weighed after being oven-dried at 60degC for at least 5 d.
- Other variables: Saplings grown under closed canopy and canopy openness were measured using hemispherical photographs; Mean annual rainfall provided; Mean annual temperature provided.
- Year collected: 2003
- Study contacts: Masahiro Aiba
Aiba2007
Data from: Aiba M and Nakashizuka T (2007). Variation in juvenile survival and related physiological traits among dipterocarp species co-existing in a Bornean forest. Journal of Vegetation Science, 18(3), pp. 379-388. DOI: 10.1111/j.1654-1103.2007.tb02550.x.
- Site Description
- Site(s) type(s): Tropical rainforest
- Geography
- latitude, longitude: 4.03, 113.83
- Site(s) history: plant grown in field wild
- Experimental or sampling design
- Design characteristics: All dipterocarp species for which enough saplings of a comparable size could be collected and which were not focused in Aiba & Nakashizuka 2005, were analysed. In November 2003, 20 - 30 sound saplings of various sizes (0.1 - 1.5m tall) of each species were sampled to determine their allometric relationships. All sampled individuals grew under closed canopies.
- Variables included: status, a.lf, a.stba, a.cp, h.t, h.c, d.ba, d.cr, c.d, m.lf, m.st, m.so, m.br, m.rt, m.to, a.ilf
- Species sampled: Dipterocarpus acutangulus, Dipterocarpus confertus, Dipterocarpus crinitus, Dipterocarpus geniculatus, Dipterocarpus globosus, Dipterocarpus pachyphyllus, Dipterocarpus palembanicus, Dipterocarpus stellatus, Dipterocarpus tempehes, Dryobalanops aromatica, Dryobalanops lanceolata, Hopea sphaerocarpa, Shorea amplexicaulis
- Research methods
- Leaf area: For each sapling, the total leaf area and maximum individual leaf area were measured using the software LIA32 for Windows 95 (K. Yamamoto) after scanning the images.
- Stem cross sectional area: Stem diameter was measured at ground using calliper at right angles.
- Height: Height was measured as the vertical distance from the ground to the highest apex.
- Crown area: Crown width was measured at right angles including the widest width. Projected area was estimated by assuming an ellipse.
- Biomass: Saplings were divided into root, stem, branches and leaf lamina. Each compartment was dried to constant weight and weighed. Leaf petioles were not included in Total leaf mass. All parts of the saplings were weighed after being oven-dried at 60degC for at least 5 d.
- Other variables: Saplings grown under closed canopy; Mean annual rainfall provided; Mean annual temperature provided.
- Year collected: 2003
- Study contacts: Masahiro Aiba
Albrektson1984
Data from: Albrektson A (1984). Sapwood basal area and needle mass of Scots pine (Pinus sylvestris L.) trees in central Sweden. Forestry, 57(1), pp. 35-43. DOI: 10.1093/forestry/57.1.35.
- Site Description
- Site(s) type(s): Boreal forest
- Geography
- latitude, longitude: 60, 16
- Site(s) history: plant grown in plantation managed
- Experimental or sampling design
- Design characteristics: The sample trees were selected as stems of mean basal area, by classes of basal area, to represent the diameter distribution of the stands.
- Variables included: age, a.ssbh, a.shbh, a.stbh, a.cp, h.t, h.c, d.bh, h.bh, d.cr, c.d, m.lf, m.st, m.so, m.br, m.rt, m.to
- Species sampled: Pinus sylvestris
- Research methods
- Stem cross sectional area: DBH measured in the field.
- Height: No additional information provided.
- Crown area: Every 10th branch, from the base to the top of the live crown, was taken systematically for the branch sample. To avoid systematic errors, the first sample branch on every sample tree was randomized. Length of these branches was used to estimate crown width.
- Biomass: Fresh weight was determined by section in the field, and converted to dry mass based on a subsample (of foliage and wood).
- Other variables: The basal area of sapwood was measured on discs from breast height. Sapwood was visually separated from heartwood after they had been treated with sulphanilic acid and sodium nitrite (Anon 1962). The width of the sapwood was calculated from the average of four measurements at right angles. The mean annual ring width in the sapwood was calculated as the width of sapwood, divided by the number of annual rings in the sapwood.
- Study contacts: Remko A. Duursma
Ando1962
Data from: Ando T, Sakaguchi K, Narita T and Satoo S (1962). Growth analysis on the natural stands of Japanese red pine (Pinus densiflora Sieb. et Zucc.) I. Effects of improvement cutting and relative growth. Bulletin of the Forestry and Forest Products Research Institute, 144, pp. 1-30.
- Site Description
- Site(s) type(s): Temperate forest
- Geography
- latitude, longitude: 36.45, 140.11
- Site(s) history: plant grown in plantation managed, field wild
- Experimental or sampling design
- Design characteristics: Study was conducted in a naturally regenerated secondary Pine forest (Block I in the Takadateyama National Forest, compartment 91-Ne, Na, and Tsu, 200 m a.s.l.). For Block III see Tadaki 1979. Three plots with size of 0.01 ha (10 m times 10 m) were set in the stand in 1951 (Ando et al. 1962). These plots were facing the south. The stand was treated to regenerate naturally during 1942 to 1947 and was estimated to be 8 years old in 1951. Plots were treated with different treatments in 1951-1952. Plot A (sparse) was thinned to avoid strong competition. Plot B (1000 trees/ha) was thinned to a density of 10,000 trees/ha in 1952. Plot C (control) was untreated. A total of 70 trees were cut down (20 from plot A, 20 from plot B, and 30 from plot C). Trees were selected randomly. Stems of sample trees were then treated with the stratified clip technique by cutting them into parts contained in horizontal layers of 0.0-0.2 m, 0.2-0.7m, and at interval of 0.5 m upward. Leaves and branches were separated.
- Variables included: age, a.stbh, h.t, h.c, d.bh, h.bh, c.d, m.lf, m.st, m.so, m.br
- Species sampled: Pinus densiflora
- Research methods
- Height: Metadata not available.
- Biomass: Measured fresh mass of stem, branch, and leaves was converted to dry mass from the ratio of dry to fresh weights (Ando et al. 1962). The ratio was estimated from subsamples dried at 80 degrees C.
- Other variables: M.I. Ishihara, H. Utsugi, H. Tanouchi, and T. Hiura conducted formal search of reference databases and digitized raw data from Ando et al. (1962). Based on this reference, meta data was also created by M. Ishihara. Species name and family names were converted by M.I. Ishihara according to the following references: Satake Y, Hara H (1989a) Wild flower of Japan Woody plants I (in Japanese). Heibonsha, Tokyo; Satake Y, Hara H (1989b) Wild flower of Japan Woody plants II (in Japanese). Heibonsha, Tokyo.
- Study contacts: Masae I. Ishihara, Hajime Utsugi, Hiroyuki Tanouchi, Tsutom Hiura
Ando1973
Data from: Ando T and Takeuchi I (1973). Growth and production structure of Acacia mollissima Willd. and Acacia dealbata Link in Saijo experimental stand. Bulletin of the Government Forest Products Research Institute, 252, pp. 149-159.
- Site Description
- Site(s) type(s): Temperate forest
- Geography
- latitude, longitude: 34, 133
- Site(s) history: plant grown in plantation managed
- Experimental or sampling design
- Design characteristics: Plots 1-A and 1-B in Maruyama experimental stand were facing the south-east at 180 a.s.l. and planted with Acacia mollissima in 1963 at the density of 2000 trees / ha and 4000 trees / ha, respectively (Ando and Takeuchi 1973). Plots 1-A and 1-B in Haseyama experimental stand were facing the north at 200 a.s.l. and planted with Acacia dealbata in 1963 at the density of 2000 trees/ha and 4000 trees/ha, respectively. Details of the plots are listed in Table 1 of Ando and Takeuchi (1973). Eight sample trees covering whole range of diameter distribution were harvested from each plot in late November to early December 1967. Sample trees were then treated with the stratified clip technique by cutting them into parts contained in horizontal layers of 1 m thickness. Fresh weight of stem, branches, leaves, and flowering buds were measured in the field. For three sample trees (large-, middle, small-sized trees) per plot, roots were excavated in quadrate plots centred on the stump of sampled tress. The area of quadrate plot was 5 square meters for a tree in density of 2000 trees/ha (plots 1-A) and 2.5 square meters for a tree in density of 4000 trees/ha (plots 1-B). All roots within this quadrate plot was assumed to be of the sample tree.
- Variables included: age, a.stbh, h.t, h.c, d.bh, h.bh, c.d, m.lf, m.st, m.so, m.br, m.rt, m.to
- Species sampled: Acacia dealbata, Acacia mearnsii
- Research methods
- Height: Metadata not available.
- Biomass: Measured fresh weight was converted to dry weight from the ratio of dry to fresh weights (Ando and Takeuchi 1973). The ratio was estimated from subsamples.
- Other variables: M.I. Ishihara, H. Utsugi, H. Tanouchi, and T. Hiura conducted formal search of reference databases and digitized raw data from Ando and Takeuchi (1973). Based on this reference, meta data was also created by M.I. Ishihara. Species names follow Ando and Takeuchi (1973).
- Study contacts: Masae I. Ishihara, Hajime Utsugi, Hiroyuki Tanouchi, Tsutom Hiura
Ando1988
Data from: Kawanabe S and Ando M (1988). Studies on the regeneration of natural forest on lower limit of cool temperate deciduous broad-leaved forest V. Biomass and growth in natural forest of Cryptomeria japonica [in Japanese with English abstract]. Bulletin of the Kyoto University Forests, 60, pp. 67-76.
- Site Description
- Site(s) type(s): Temperate forest
- Geography
- latitude, longitude: 35.33, 135.72
- Site(s) history: plant grown in field wild
- Experimental or sampling design
- Design characteristics: Sixteen Cryptomeria japonica trees with stem diameter ranging from 6 to 52 cm were cut at ground level (Kawanabe and Ando 1988). Additionally, 37 broadleaved trees were cut. Stem diameter and tree height were measured. Sample trees were then treated with the stratified clip technique by cutting them into parts contained in horizontal layers of 1 m thickness for Cryptomeria japonica, 2 m thickness for Castanea crenata, and 0.5 m thickness for other broadleaved tree species.
- Variables included: a.stba, a.stbh, a.stbc, h.t, h.c, d.ba, d.bh, h.bh, c.d, m.lf, m.st, m.so, m.br
- Species sampled: Acanthopanax sciadophylloides, Castanea crenata, Clethra barbinervis, Cryptomeria japonica, Daphniphyllum macropodum, Fagus crenata, Fraxinus sieboldiana, Hamamelis japonica, Ilex macropoda, Ilex pedunculosa, Ilex sugerokii, Lindera umbellata, Lyonia ovalifolia, Magnolia salicifolia, Menziesia ciliicalyx, Quercus crispula, Quercus salicina, Sorbus commixta, Styrax japonica, Symplocos coreana
- Research methods
- Stem cross sectional area: Estimated from stem diameter.
- Height: Measured by measuring tape after trees were felled.
- Biomass: Fresh weights of leaves, branches and stem were measured separately for each layer and tree (Kawanabe and Ando 1988). In Cryptomeria japonica, leaves and green braches were difficult to seperate. Green parts of the main axis of the stem or large branches were treated as branch and those of lateral axes as leaves. Subsamples of each organ from each layer and each tree were taken and oven-dried at 80 degrees C for 48 hours or more. The dry-to-fresh weight ratios of these subsamples were used to calculate total dry weight of each tree component.
- Other variables: Species name and family names were converted by M.I. Ishihara according to the following references: Satake Y, Hara H (1989a) Wild flower of Japan Woody plants I (in Japanese). Heibonsha, Tokyo; Satake Y, Hara H (1989b) Wild flower of Japan Woody plants II (in Japanese). Heibonsha, Tokyo.
- Study contacts: Makoto Ando
Aspinwall2013
Data from: Aspinwall MJ, King JS and McKeand SE (2013). Productivity differences among loblolly pine genotypes are independent of individual-tree biomass partitioning and growth efficiency. Trees, 27(3), pp. 533-545. ISSN 0931-1890, 1432-2285. DOI: 10.1007/s00468-012-0806-4.
- Site Description
- Site(s) type(s): Temperate forest
- Geography
- latitude, longitude: 34.823, -77.303
- Site(s) history: plant grown in plantation managed
- Experimental or sampling design
- Design characteristics: Completed above and belowround harvests were conducted during the winter of 2008 and the winter of 2009. We harvested 9 Pinus taeda genotypes in total; 3 clones, 3 full-sib families, and 3 half-sib families. 2 clones were planted as containerized and bare-root seedlings, such that there were actually 11 individuals. In winter 2008 (age 2), we harvested four trees of each genotype and the study location (Onslow County, NC, USA, managed pine plantation). We conducted the same harvesting protocol on 2 trees per genotype in winter 2009 (age 3). With one missing tree, we have data on 65 trees.
- Variables included: status, light, age, a.lf, a.stba, a.stbh, h.t, d.ba, d.bh, m.lf, m.st, m.so, m.br, m.rf, m.rc, m.rt, m.to, ma.ilf
- Species sampled: Pinus taeda
- Research methods
- Leaf area: For each tree, a randomly sampled subset of needles was collected from throught the canopy. These needles were scanned (Epson scanner) and the images were analyzed using ImageJ software to estimate total fresh area of the subsample. The needles were then oven dried (70 C), and one-side SLA (cm2 g-1) for each tree was determined. This SLA values was then multiplied by total needle dry mass to estimate total canopy one-sided leaf area (m2)
- Stem cross sectional area: Stem diameter was measured at the groundline using digital calipers. Measures were taken in two directions. Diameter at breast-height was also measured on age 3 trees.
- Height: Height was measured as the vertical distance from the ground to the highest apex.
- Crown area: Not measured.
- Biomass: The general harvest protoco was as follows: Ground-line diameter and height were measured and each tree was felled onto a tarp. The aboveground portion was then separated into foliage, branches, and stem. Briefly, total fresh mass of each component was measured in the field and a subsample representing *25 % of the component fresh mass was weighed and dried to a constant mass at 70 C. Total dry mass (kg) of each component was calculated as the product of total fresh weight and subsample moisture content (%). Following the aboveground harvest, a 0.5 m3 volume of soil, centered on the cut stem, was carefully excavated so that taproot, coarse root, and fine root biomass could be estimated. Samples were sieved, washed and dried at 70 C to estimate dry mass.
- traits: SLA was determined as described above for Leaf area
- Other variables: latitude, longitude, mean annual precipitation, and mean annual temperature are provided. We also measured tap root dry mass separately, but this data can be added to get total coarse root dry mass if necessary.
- Study contacts: Michael J. Aspinwall
Baltzer2007
Data from: Baltzer JL and Thomas S (2007). Physiological and morphological correlates of whole-plant light compensation point in temperate deciduous tree seedlings. Oecologia, 153(2), pp. 209-223. DOI: 10.1007/s00442-007-0722-2.
- Site Description
- Site(s) type(s): Temperate forest
- Geography
- latitude, longitude: 43.66146, -79.40006
- Site(s) history: plant grown in glasshouse
- Experimental or sampling design
- Design characteristics: Seeds were of local provenance obtained from the National Tree Seed Centre (Canadian Forest Service Atlantic Forestry Centre, Fredericton, NB) and grown in glasshouse at the Faculty of Forestry, University of Toronto (CA), under high and low nutrient and light treatments. Individuals sampled from 1 to 5 months of age. Biomass harvests were conducted on 5-6 June, 21-23 July and 3-5 September 2003. Betula papyrifera and Populus grandidentata showed low germination rates and therefore seedlings were not available for the first harvest. Additionally, both species had 100% mortality in low light and thus data are missing for low-light measurements. For the first two harvests, five seedlings per species and treatment were selected at random. The final harvest included all surviving seedlings.
- Variables included: age, a.lf, a.stba, h.t, d.ba, m.lf, m.st, m.so, m.rt, m.to, a.ilf, ma.ilf
- Species sampled: Acer rubrum, Acer saccharum, Betula alleghaniensis, Betula papyrifera, Fraxinus americana, Quercus rubra, Ulmus americana
- Research methods
- Leaf area: Fresh leaves from each harvest were measured for individual area and total area.
- Stem cross sectional area: Stem diameter measured at base.
- Height: Total height measured along the stem, from base to apical bud.
- Biomass: Seedlings were divided into roots, stems and leaves which were then oven dried for 5 days at 60 degC to constant weight and weighted.
- Traits: age (months), total height (cm), stem diameter at base (mm), leaf area (cm^2), total leaf mass (g), total root mass (g), stem mass (g), Single leaf area (cm^2), leaf mass per area (g/cm^2).
- Other variables: In the final harvest fresh leaf area of leaves measured for gas-exchange was determined for calculation of leaf mass per area; Photon flux density (PFD) was measured using Hobo Weather Stations (Onset Computer, Bourne, Mass.).
- Year collected: 2003
- Study contacts: Jennifer L. Baltzer
Baraloto2006
Data from: Baraloto C, Bonal D and Goldberg DE (2006). Differential seedling growth response to soil resource availability among nine neotropical tree species. Journal of Tropical Ecology, 22(05), pp. 487-497. DOI: 10.1017/S0266467406003439.
- Site Description
- Site(s) type(s):
- Geography
- latitude, longitude: 5.13, -52.65034
- Site(s) history: plant grown in glasshouse
- Experimental or sampling design
- Design characteristics: The experiment was conducted in a shadehouse at the INRA research facilities in Kourou, French Guiana, approximately 60km from permanent plots at Paracou, French Guiana (5.3N,52.92W). The nine focal species were chosen to test for differences among species not exhibiting any strong edaphic preferences at the seedling stage at Paracou (Baraloto & Goldberg 2004) but representing the broad range of seed size and specific leaf area found among the tree species occurring in lowland tropical forest in French Guiana (reported in Baraloto 2001; see Table 1). Seeds were collected from within a 10-m radius of each of a minimum of five adult trees per species at Paracou and mixed with respect to maternal source. 867 individuals were sampled and varied from 1.09 to 9.93 mm basal stem diameter. The experiment consisted of a factorial design of two soil types (Brown clay or White sand), two water treatments (drought, no drought) and two fertilization treatments (phosphate addition, no phosphate addition).
- Variables included: a.lf, a.stba, h.t, d.ba, m.lf, m.st, m.so, m.rt, m.to, ma.ilf
- Species sampled: Dicorynia guianensis Amshoff , Eperua falcata Aubl., Eperua grandiflora (Aubl.) Benth. , Goupia glabra Aubl. , Jacaranda copaia (Aubl.) D. Don , Qualea rosea Aubl., Recordoxylon speciosum (Benoist) , Sextonia rubra (Mez) van der Werff, Virola michelii Heckel
- Research methods
- Leaf area: Leaf surface area was measured immediately after harvest with a LICOR3000 leaf area meter (LI-COR Inc, Lincoln, Nebraska, USA). Mass-specific leaf area (SLA) was calculated as the ratio of leaf area to leaf dry biomass.
- Stem cross sectional area: Stem diameter was measured at soil surface.
- Height: Height was measured on each individual.
- Biomass: Seedlings were partitioned into leaf, stem and petiole, root and remaining cotyledons, which were then dried at 50degC, to constant weight and weighed.
- Traits: Basal diameter (mm), Height at one year harvest age (cm), Leaf surface area (cm^2), Mass-specific leaf area (m2/kg), Leaf biomass at harvest (g), Stem biomass at harvest (g), Root biomass at harvest (g), Shoot (=leaf + stem) biomass at harvest (g), Total biomass at harvest (g).
- Other variables: Light environment was measured by quantum sensors. 6.0%-1.2% of energy transmitted to sensors placed in adjacent sites open to full sun; Vegetation type - Tropical Rainforest.
- Year collected: 1998
- Study contacts: Christopher Baraloto
Battaglia1998
Data from: Battaglia M, Cherry M, BEadle C, Sands PJ and Hingston A (1998). Prediction of leaf area index in eucalypt plantations : effects of water stress and temperature. Tree Physiology, 18, pp. 521-528.
- Site Description
- Site(s) type(s): Temperate forest
- Geography
- latitude, longitude: -43.35, 146.9; -43.3, 147.6; -42.81667, 147.5833; -41.16667, 147.2833
- Site(s) history: plant grown in plantation managed
- Experimental or sampling design
- Design characteristics: Whole hectare of trees measured to develop frequency of diameters, then divided into six classes and random tree from each class selected and felled. All branches measured along stem and diameter taken. Crown divided into thirds and 5 branches in each crown zone sampled.
- Variables included: status, age, a.lf, a.ssbh, a.ssbc, a.shbh, a.shbc, a.stba, a.stbh, a.stbc, h.t, h.c, d.ba, d.bh, h.bh, c.d, m.lf, ma.ilf
- Species sampled: Eucalyptus nitens
- Research methods
- Leaf area: For each branch in each crown zone a sub-sample of 10 leaves taken and leaf area measured. Leaves dried at 70C to constant weitght
- Stem cross sectional area: Stem diameter measure with diameter tape at 1.3m
- Height: Height was measured on felled trees from ground to vertex with a tape
- Crown area: Not measured, although branch lengths and position on crown were but not branch angle
- Biomass: The general harvest protoco was as follows: see references in appended. Essentially trees felled and stratified random selection of branches collected and mass of leaves in each sampled class assessed
- traits: SLA was determined as described above for Leaf area
- Other variables:
- Study contacts: Michael Battaglia
BondLamberty2002
Data from: Bond-Lamberty B, Wang C and Gower ST (2002). Aboveground and belowground biomass and sapwood area allometric equations for six boreal tree species of northern Manitoba. Canadian Journal of Forest Research, 32(8), pp. 1441-1450. DOI: 10.1139/x02-063.
- Site Description
- Site(s) type(s): Boreal forest
- Geography
- latitude, longitude: 55.92019, -98.38986; 55.86407, -98.4826; 55.90644, -98.97953; 56.46049, -99.97442; 55.88691, -98.67479; 55.86351, -98.48128; 55.90487, -98.97767; 56.46217, -99.97617; 55.8796, -98.48088; 55.90813, -98.51922; 55.88, -98.48; 55.91993, -98.38812; 56.33, -94.67; 55.92842, -98.62396; 55.89575, -98.28706; 55.88155, -98.47954; 55.90806, -98.51529
- Site(s) history: plant grown in field wild
- Experimental or sampling design
- Design characteristics: Aboveground biomass relations were based on 326 trees harvested during three field seasons, 1994, 1999, and 2000. Allometric coefficients for trees harvested in 1994 were previously published (Gower et al. 1997), although with different coefficients, as this study denominates tree mass in grams and not kilograms. In addition, Gower et al. (1997) did not measure D0 and only reported equations for mature trees based on DBH. Trees were destructively sampled between mid-July and early August in each year. Stems were cut at the soil surface.
- Variables included: status, age, a.ssbh, a.stba, a.stbh, h.t, d.ba, d.bh, h.bh, m.lf, m.rc
- Species sampled: Betula papyrifera, Larix laricina, Picea mariana, Pinus banksiana, Populus tremuloides, Salix spp.
- Research methods
- Leaf area: Given in Bond-Lamberty et al. (2002), doi: 10.1093/treephys/22.14.993
- Stem cross sectional area: diameter at soil surface (D0), measured immediately above any root collar swelling; DBH was also recorded.
- Height: Tree height was measured from ground to base of the terminal bud.
- Biomass: Samples were placed in a forced-air oven, dried to a constant mass at 70degC, and sorted into new (current year) foliage, older foliage, new (current-year) branches, older branches, and stem tissue. Conifer cones were discarded. Stems of large young jack pine trees were cut into 1-m sections and weighed on an electronic balance, while the stems of other large trees were cut into 2-m sections and weighed. A 2 cm thick disk was cut from the base of each stem section and weighed on an electronic balance. The dry biomass of each stem section was calculated by multiplying the wet mass of each stem section by the dry/wet ratio of each stem disk. The total dry biomass of each stem was calculated by summing the dry biomass of all stem sections.
- Traits: Tree height (cm), Diameter at soil surface (cm), Diameter at 1.37 m (cm), Total stem biomass (g), Total foliage biomass (g), Sapwood area at DBH or D0 (cm^2), Coarse root biomass (g), age (years).
- Year collected: 1994, 1999-2000
- Study contacts: Ben Bond-Lamberty
Brown1978
Data from: Brown JK (1978). INT-197: Weight and density of crowns of Rocky Mountain conifers. U.S. Department of Agriculture, Forest Service, Intermountain Forest and Range Experiment Station. LINK.
- Site Description
- Site(s) type(s): Temperate forest
- Geography
- latitude, longitude: 47.44, -115.7
- Site(s) history: plant grown in field wild
- Experimental or sampling design
- Design characteristics: The sampling was designed to include the natural variation in crown weight by selecting trees from stands on poor-to-good sites and from low-to-high stand density conditions throughout western Montana and nothern Idaho.
- Variables included: status, age, a.stbh, a.cp, h.t, h.c, d.bh, h.bh, d.cr, c.d, m.lf, m.br
- Species sampled: Abies grandis, Abies lasiocarpa, Larix occidentalis, Picea engelmannii, Pinus albicaulis, Pinus monticola, Pinus ponderosa, Pseudotsuga menziesii var. glauca, Thuja plicata, Tsuga heterophylla
- Research methods
- Leaf area: Not measured.
- Stem cross sectional area: DBH outside bark.
- Height: Total tree height (includes stump).
- Crown area: Crown width was measured as the average of two perpendicular measurements taken at the bottom of each crown section.
- Biomass: Fresh weight was measured by crown section in the field, and converted to dry mass using moisture content determined from sample branches. For small trees, most or all of the entire crown was often ovendried.
- Study contacts: Remko A. Duursma
Burger1953
Data from: Burger H (1953). Holz, Blattmenge und Zuwachs. Fichten in gleichaltrigen Hochwald. Mitt. Schweiz. Mitteilungen der Schweizerischen Anstalt för das forstliche Versuchswesen, 29, pp. 38-130.
- Site Description
- Site(s) type(s): Temperate forest
- Geography
- latitude, longitude: 47.38, 8.51
- Site(s) history: plant grown in plantation managed
- Experimental or sampling design
- Design characteristics: Trees were selected to cover a range in size and dominance classes, from a number of stands ranging in altitude from 400 to 1800 m asl.
- Variables included: status, age, a.lf, a.stbh, a.cp, h.t, h.c, d.bh, h.bh, d.cr, c.d, m.lf, m.br
- Species sampled: Picea abies
- Research methods
- Leaf area: Methods unknown.
- Stem cross sectional area: DBH (measured by individual).
- Height: Unknown (measured by individual).
- Biomass: Branch biomass was converted from fresh weight and water content as provided in the publication.
- Study contacts: Remko A. Duursma
Camac0000
Data from: Camac J (Unpublished).
- Site Description
- Site(s) type(s): Shrubland
- Geography
- latitude, longitude: -36.90574, 147.2779
- Site(s) history: plant grown in field wild
- Experimental or sampling design
- Design characteristics: Seedlings of the four dominant alpine/subalpine shrub species were randomly harvested from a heathland site that was burnt by a January 2003 wildfire. At least 30 individuals were sampled in each species. Seedlings collected for harvest spanned the range of sizes present at the site, and always occurred in bare ground patches (hence were exposed to direct sunlight).
- Variables included: light, a.stba, h.t, d.ba, m.lf, m.st, m.so
- Species sampled: Asterolasia trymalioides, Grevillea australis, Phebalium squamulosum, Prostanthera cuneata
- Research methods
- Height: Height was measured as the vertical distance from the ground to the highest apex. This measurement was made using calipers
- Diameter at crown base: Diameter of stem at first branch. This diameter was measured using a caliper prior to harvesting
- Diameter at stem base: Diameter of stem at ground level. This diameter was measured using a caliper prior to harvesting
- Leaf mass: All leaves on each seedling were dried in a oven for 48 hours at 70oC
- Stem mass: Stems and branches of each seedling were dried in a oven for 48 hours at 70oC
- Total mass: Total mass was the sum of leaf and stem dry mass.
- Year collected: 2010
- Study contacts: James Camac
Claveau2002
Data from: Claveau Y, Messier C, Comeau PG and Coates KD (2002). Growth and crown morphological responses of boreal conifer seedlings and saplings with contrasting shade tolerance to a gradient of light and height. Canadian Journal of Forest Research, 32(3), pp. 458-468. DOI: 10.1139/x01-220.
- Site Description
- Site(s) type(s): Boreal forest
- Geography
- latitude, longitude: 48, -79; 54, -122; 52, -121
- Site(s) history: plant grown in field wild
- Experimental or sampling design
- Design characteristics: Three study sites in British Columbia and six in Quebec were selected (Table 1). They were selected to ensure that trees of each species could be sampled across a full light gradient (Fig. 1). For each species, care was taken to select stands within the same soil drainage and soil texture classes. Stands with multicanopied structure were preferred, because they offered better opportunities for finding a range of sample tree heights across light gradients. Areas disturbed within the last 10 years (e.g., harvesting, blowdown, insect related attack) were avoided. Study trees were sampled along 5 m wide transects established along gradients of stand density.
- Variables included: status, light, age, a.stba, a.cp, h.t, h.c, d.ba, d.cr, c.d
- Species sampled: Abies balsamea, Abies lasiocarpa, Picea glauca, Picea glauca x Picea engelmannii, Pinus banksiana, Pinus contorta
- Research methods
- Total height: Stem length from ground level to the tip of the leader.
- Height to crown base: Distance from the ground to the base of the crown.
- Diameter of stem at base: Diameter of the stem above the root swell. This diameter was measured using a caliper.
- Diameter of crown: Average of crown diameters taken on a North-South and East-West axis.
- Crown depth: Distance from the tip of the apex down to the base of the crown.
- Study contacts: Yves Claveau
Claveau2005
Data from: Claveau Y, Messier C and Comeau PG (2005). Interacting influence of light and size on aboveground biomass distribution in sub-boreal conifer saplings with contrasting shade tolerance. Tree Physiology, 25(3), pp. 373-384. DOI: 10.1093/treephys/25.3.373.
- Site Description
- Site(s) type(s): Boreal forest
- Geography
- latitude, longitude: 48, -79; 54, -122; 52, -121
- Site(s) history: plant grown in field wild
- Experimental or sampling design
- Design characteristics: Three study sites in British Columbia and six in Quebec were selected (Table 1). They were selected to ensure that trees of each species could be sampled across a full light gradient (Fig. 1). For each species, care was taken to select stands within the same soil drainage and soil texture classes. Stands with multicanopied structure were preferred, because they offered better opportunities for finding a range of sample tree heights across light gradients. Areas disturbed within the last 10 years (e.g., harvesting, blowdown, insect related attack) were avoided. Study trees were sampled along 5 m wide transects established along gradients of stand density.
- Variables included: status, light, age, a.lf, a.stba, h.t, d.ba, m.lf, m.st, m.so, m.br, ma.ilf
- Species sampled: Abies balsamea, Abies lasiocarpa, Picea glauca, Picea glauca x Picea engelmannii, Pinus banksiana, Pinus contorta
- Research methods
- Leaf area of whole plant: Leaf area was estimated using the specific needle area and weight mass of each needle age class
- Area of sapwood cross section at base: Sapwood area was estimated from a disk sawn at the base of the seedling. Sapwood area was located using a backlight and then drawn on the disk . The surface of the shaded area was measured using the image analysis software NIH Image
- Total height: Stem length from ground level to the tip of the leader
- Diameter of stem at base: Diameter of the stem above the root swell. This diameter was measured using a caliper.
- Leaf mass: Mass of all needles. Needles were were dried in a forced-air oven for 48 h at 70 C. Abies trees taller than 1 m were sub-sampled. Branches were first sorted into groups of both similar length and comparable ratios of foliage versus wood mass (visual estimation). One branch from each group was processed. Each group of the remaining branches was weighed to determine fresh mass. To determine dry mass, ratios of ovendried mass to fresh mass of the processed branch from each group of branches were calculated and applied to the corresponding group. To determine the total dry mass of needle and branches of each tree, the estimated masses were summed.
- Mass of all stem tissue: Mass of stem and branches. They were dried in a forced-air oven for 48 h at 70 C, whereas bigger stems were dried at 70 C for 7 days. Abies trees taller than 1 m were sub-sampled. Branches were first sorted into groups of both similar length and comparable ratios of foliage versus wood mass (visual estimation). One branch from each group was processed. Each group of the remaining branches was weighed to determine fresh mass. To determine dry mass, ratios of ovendried mass to fresh mass of the processed branch from each group of branches were calculated and applied to the corresponding group. To determine the total dry mass of needle and branches of each tree, the estimated masses were summed.
- Mass of all above-ground structures: See Leaf mass and Mass of all stem tissue.
- Branch mass: Branches were dried in a forced-air oven for 48 h at 70 C. Abies trees taller than 1 m were sub-sampled. Branches were first sorted into groups of both similar length and comparable ratios of foliage versus wood mass (visual estimation). One branch from each group was processed. Each group of the remaining branches was weighed to determine fresh mass. To determine dry mass, ratios of ovendried mass to fresh mass of the processed branch from each group of branches were calculated and applied to the corresponding group. To determine the total dry mass of needle and branches of each tree, the estimated masses were summed.
- Leaf mass per area: m.lf/a.lf
- Other variables: Saplings grown under closed canopy and canopy openness were measured using hemispherical photographs
- Study contacts: Yves Claveau
Coll2008
Data from: Coll L, Potvin C, Messier C and Delagrange S (2008). Root architecture and allocation patterns of eight native tropical species with different successional status used in open-grown mixed plantations in Panama. Trees - Structure and Function, 22(4), pp. 585-596. DOI: 10.1007/s00468-008-0219-6.
- Site Description
- Site(s) type(s): Tropical seasonal forest
- Geography
- latitude, longitude: 9.325, -79.05222
- Site(s) history: plant grown in plantation managed
- Experimental or sampling design
- Design characteristics: In August 2001, intensive allometric measurements were initiated. Saplings/trees from each of the eight species were grouped in five size class categories based on their height. The height range for each species in July 2001 was as follows: Luehea (0.56-4.42 m), Cordia (1.9-3.32 m), Sterculia (0.58-5.15 m), Antirrhoea (0.57-2.77 m), Enterolobium (1.66-2.48 m), Cedrela (0.56-3.57 m), Tabebuia (0.37-3.18 m) and Hura (0.76-4.85 m). Care was taken to sample a similar height range from all species. Differences in total height among individuals were caused by differences in growth caused by micro-scale variations in topography. All sampled individuals were healthy. Within each size category, one individual per species was randomly selected for allometric and biomass measurements. Sample size was thus five trees per species for a total of forty saplings. Each of the experimental saplings was harvested and the root system excavated and the following traits were measured: (1) diameter at 10 cm from the ground; (2) height; (3) number, length and biomass of branches;(4) trunk biomass and (5) root biomass. All leaves from the saplings were harvested and dried to provide total leaf biomass.
- Variables included: status, age, a.lf, a.stba, h.t, d.ba, m.lf, m.st, m.so, m.br, m.rt, m.to, ma.ilf
- Species sampled: Antirrhoea trichantha, Cedrela odorata, Cordia alliodora, Hura crepitans, Luehea seemannii, Sterculia apetala, Tabebuia rosea
- Research methods
- Leaf area: Specific leaf area (SLA) calculated from another study (Delagrange et al. 2008) was used to scale up biomass of leaves to total leaf area per tree. SLA values were obtained from fifteen to twenty-five leaves per species where the leaf area had been measured with a leaf area meter (Li-Cor 3100) before being dried and weighed.
- Stem cross sectional area: Stem diameter was measured at 10cm from the soil surface.
- Height: Height was measured on each individual.
- Biomass: Dry mass of all material.
- Traits: specific leaf area.
- Other variables: branch biomass (g), total leaf biomass (g), total aboveground biomass (g), total belowground biomass (g), total plant biomass (g), stem.biomass (g)
- Year collected: 2001
- Study contacts: Lluís Coll, Catherine Potvin
Dannoura2006
Data from: Dannoura M, Suzuki M, Kominami Y, Goto Y and Kanazawa Y (2006). Estimation of root biomass and root surface area in a broad-leaved secondary forest in the southern part of Kyoto Prefecture. Journal of the Japanese Forest Society, 88, pp. 120-125.
- Site Description
- Site(s) type(s): Temperate forest
- Geography
- latitude, longitude: 34.78, 135.83
- Site(s) history: plant grown in field wild
- Experimental or sampling design
- Design characteristics: In the November 2000 and September 2001, 16 trees were harvested in a forest adjacent to the Yamashiro Experimental Forest (Dannoura et al. 2006). Each tree was cut down and roots were excavated carefully. One sample tree (Ilex pedunculosa, DBH = 47.49 cm) had been uprooted by strong wind and lost some parts of roots.
- Variables included: age, a.stba, a.stbh, h.t, d.ba, d.bh, h.bh, m.so, m.rt, m.to
- Species sampled: Clethra barbinervis, Ilex pedunculosa, Quercus glauca, Quercus serrata
- Research methods
- Height: Tree height was measured after trees were cut down except Ilex pedunculosa tree with DBH = 47.49 cm, which was estimated from a allometric equation (Dannoura et al. 2006).
- Biomass: Aboveground and root dry weights were measured after oven-dried at 95 degrees C for 48 hours (Dannoura et al. 2006). Biomass of each lost root in Ilex pedunculosa sample tree (DBH = 47.49 cm) was estimated from the root diameter of the end point of the remaining root and the allometric equation RW = 0.0738 d ^2.4652 where RW was dry weight (g) of a root with basal root diameter of d (mm). This equation was obtained from 23 root samples (d = 7.0-34.7 mm) collected from this tree.
- Other variables: Root biomass data for trees reported in Goto et al. (2003) are merged with the data of Goto2013 by M.I. Ishihara. Only data for trees not reported in Goto et al. (2003) are listed here. Species name and family names were converted by M.I. Ishihara according to the following references: Satake Y, Hara H (1989a) Wild flower of Japan Woody plants I (in Japanese). Heibonsha, Tokyo; Satake Y, Hara H (1989b) Wild flower of Japan Woody plants II (in Japanese). Heibonsha, Tokyo.
- Study contacts: Masako Dannoura
Delagrange0000a
Data from: Delagrange S (Unpublished).
- Site Description
- Site(s) type(s): Temperate forest
- Geography
- latitude, longitude: 46.12778, -75.15667
- Site(s) history: plant grown in field wild, field experimental
- Experimental or sampling design
- Design characteristics: 48 plots of 30m2 were created in the center of small (n=16) and big (n=16) gaps as well as in the nearby understory (n=16). Then a maximum of 5 seedlings of both species were harvested carrefully in the center, North, South, West and East part of the 30m2 plot.
- Variables included: status, light, a.lf, a.stba, a.cp, h.t, h.c, d.ba, d.cr, c.d, m.lf, m.st, m.so, m.rt, m.to, ma.ilf
- Species sampled: Acer saccharum, Fagus grandifolia
- Research methods
- Leaf area: Leaf area was recorded using LI-3000 device from LiCOR while leaves were still fresh (i.e. right back from the field).
- Stem cross sectional area: Stem diameter was recorded using a caliper at the colar and before seedling harvest.
- Height: Height was measured using a measuring tape before seedling harvest.
- Crown area: Crown width was measured as the mean of 2 perpendicular diameters.
- Biomass: Tree compartments were partitioned and dried at 70 deg C for several days until measured mass was constant.
- Traits: Crown height was measured as the lenght of the stem supporting alive branches or leaves. LMA was calculated from total leaf mass and total leaf area.
- Study contacts: Sylvain Delagrange
Delagrange0000b
Data from: Delagrange S (Unpublished).
- Site Description
- Site(s) type(s): Temperate forest
- Geography
- latitude, longitude: 45.99722, -75.325
- Site(s) history: plant grown in field wild
- Experimental or sampling design
- Design characteristics: 60 transects were done in 4 sugar maple and yellow birch stands. Seedlings and saplings were selected along the transect to cover the largest size gradient. Individuals were then harvested carefully to obtain total biomass.
- Variables included: status, light, age, a.lf, a.stba, a.cp, h.t, h.c, d.ba, d.cr, c.d, m.lf, m.st, m.so, m.br, m.rf, m.rc, m.rt, m.to, ma.ilf
- Species sampled: Betula alleghaniensis
- Research methods
- Leaf area: leaf area was calculated using a scanner. For small individuals, total leaf area was scanned while for bigger saplings only half or a third of the leaf area was scanned.
- Stem cross sectional area: Stem Diameter was measured using a digital caliper
- Height: height was measured using a measuring tape.
- Crown area: Crown width was measured as the mean of 2 perpendicular diameters.
- Biomass: Individuals compartments were partiotioned and then dried until weigth remains constant.
- Traits: Crown height was measured as the lenght of the stem supporting alive branches or leaves. LMA was measured using total leaf area and biomass excepted on bigger individuals for which a subsample was used.
- Study contacts: Sylvain Delagrange
Delagrange2004
Data from: Delagrange S, Messier C, Lechowicz MJ and Dizengremel P (2004). Physiological, morphological and allocational plasticity in understory deciduous trees: importance of plant size and light availability. Tree Physiology, 24(7), pp. 775-784. DOI: 10.1093/treephys/24.7.775.
- Site Description
- Site(s) type(s): Temperate forest
- Geography
- latitude, longitude: 46.91, -71.67
- Site(s) history: plant grown in field experimental, field wild
- Experimental or sampling design
- Design characteristics: After 4 years of treatment (opening and/or shading nets) 46 sugar maple and 44 yellow birch naturally regenerated were sampled in gaps and in the understory. 1 individual of each species was harvested in each gap excepted if the species was missing.
- Variables included: status, light, age, a.lf, a.stba, a.cp, h.t, h.c, d.ba, d.cr, c.d, m.lf, m.st, m.so, m.br, m.rf, m.rc, m.rt, m.to, ma.ilf, r.st, n.lf
- Species sampled: Acer saccharum, Betula alleghaniensis
- Research methods
- Leaf area: leaf area was measured on a subsample of leaves to generate LMA. Total leaf mass and LMA was then used to calculate total leaf area
- Stem cross sectional area: Stem diameter at collar was measured using a caliper.
- Height: Height was measured using a measuring tape.
- Crown area: Crown width was calculated as the mean of 2 perpendicular diameters.
- Biomass: Tree compartments (roots (fine: < 2 mm, coarse: > 2 mm), stem, branches and leaves) were dried separately at 65degC for 48 h and weighed.
- Traits: LMA was measured on cored disks taken from a well exposed leaf used for gas exchange measurments. Leaf nitrogen concentration was measured using an elemental NCS 2500 analyzer (ThermoQuest, Milan Italy). Crown height was measured as the stem lenght supporting alive branches or leaves. Wood density was calculated as the force to displace a volume of water equivalent to stem section volume.
- Study contacts: Sylvain Delagrange
Domec2012
Data from: Domec J, Lachenbruch B, Pruyn M and Spicer R (2012). Effects of age-related increases in sapwood area, leaf area, and xylem conductivity on height-related hydraulic costs in two contrasting coniferous species. Annals of Forest Science, 69(1), pp. 17-27. DOI: 10.1007/s13595-011-0154-3.
- Site Description
- Site(s) type(s): Temperate forest
- Geography
- latitude, longitude: 43.53, -122.72; 43.58, -121.68; 42.23, -120.07; 42.95, -123.35; 41.18, -123.21; 44.65, -123.23
- Site(s) history: plant grown in field wild
- Experimental or sampling design
- Design characteristics: Five age classes of Douglas-fir and 4 age classes of ponderosa pine were studied. Locations with different impacts (natal regeneration, planted thinned, planted) across the state of Oregon were sampled. Trees were felled and had the center of the internodes marked. Internodes were just distal to branch whorls at increasing number of nodes.
- Variables included: lai, status, light, age, a.lf, a.ssbh, a.shbh, a.stbh, h.t, h.c, d.bh, h.bh, c.d, m.lf, a.ilf, ma.ilf, r.ss, r.sh
- Species sampled: Pinus ponderosa, Pseudotsuga menziesii
- Research methods
- Leaf area: Out of >250-600 trees (depending on the age class), 12 trees by age class were randomly selected for destructive sampling of leaf area. Foliage attached to and distal to each segment was collected to determine leaf dry mass, and subsampled to determine leaf area/dry mass conversions (specific leaf area). Total leaf area was then calculated from the total dry mass and the specific leaf area. For the old-growth trees we kept 25% of the mass in all zones and for the saplings, intermediate and younger trees we saved 100% of the mass in all zones, but processed the samples identically to the old trees
- Height: After the trees were felled, total tree heights and base of the live crown heights were measured as the vertical distance from the ground.
- Traits: Specific leaf area: For Douglas-fir needles, the projected area of fresh foliage samples was determined using a video camera and NIH Image version 1.52 (public domain software). The projected area of each ponderosa pine needle was measured using a digital caliper, and assuming that all three needles of each fascicle represent a cylinder. The samples were then dried and weighed to establish the specific leaf area (SLA = the inverse of leaf mass per area) corresponding to fresh area to dry mass ratios.
- Year collected: 1998-2000
- Study contacts: Jean-Christophe Domec
Epron2011
Data from: Epron D, Laclau JP, Almeida JCR, Goncalves JLM, Ponton S, Sette CR, Delgado-Rojas JS, Bouillet J and Nouvellon Y (2012). Do changes in carbon allocation account for the growth response to potassium and sodium applications in tropical Eucalyptus plantations? Tree Physiology, 32(6), pp. 667-679. DOI: 10.1093/treephys/tpr107.
- Site Description
- Site(s) type(s): Woodland
- Geography
- latitude, longitude: -23.04472, -48.63
- Site(s) history: plant grown in plantation managed
- Experimental or sampling design
- Design characteristics: Before each sampling campaign tree height and tree circumference were measured on three inner plots which contained 25 tree positions for each fertilization regime (excluding 2 buffer rows). Eight trees covering the range of basal area were destructively sampled at each age for each fertilization regime. The mass of each tree component was measured on-site and sub-samples were dried until constant weight at 65 C to estimate the dry mass of each tree component. Allometric relationships were then established and applied to stand inventory.
- Variables included: lai, status, light, age, a.lf, a.ssbh, a.shbh, a.sbbh, a.stbh, a.cp, h.t, h.c, d.bh, h.bh, d.cr, c.d, m.lf, m.sb, m.st, m.so, m.br, m.rc, n.lf, n.ss, n.sb
- Species sampled: Eucalyptus grandis (W. Hill ex Maiden)
- Research methods
- Leaf area: The green crown length of the sampled trees was divided into three equal-length sections (lower, middle and upper). All leaves of each section were removed and weighed. Thirty leaves were randomly selected in each section, and their fresh mass and area were immediately measured. These leaves were then dried at 65 C and the dry weight of each sub-sample was used in conjunction with its measured area to calculate the specific leaf area (SLA) for each crown section. The dry weight of leaves in each section was multiplied by the SLA value to estimate the leaf area in each tree section. Total tree leaf area was estimated summing the leaf area of the 3 sections.
- Stem cross sectional area: Stem circumference over bark was measured at breast height (1.30 m). After felling, a disc of stem was cut at a height of 1.30 m and the bark was removed. The circumference under bark was measured on the disc and the stem cross sectional areas over bark and under bark were calculated from the measurements of stem circumference. Colored water was passed under pressure through a piece of trunk at 1.30 m above the ground to determine the sapwood area for a subsample of the trees to establish an allometric relationship that was applied to the other trees.
- Height: Tree height was measured after felling with a measuring tape.
- Crown area: Crown diameter in the planting row and in the inter-row were measured before felling using a plumb to estimate the position of the leaves the farthest from the trunk. Crown area was estimated considering that the crown was circular.
- Biomass: Biomass was measured destructively for each tree component. All the leaves and branches were weighed in situ and a sub-sample was dried at 65 C to estimate the dry matter of each tree component.
- Traits: Specific leaf area (SLA) was measured in each third of the crown (lower, middle and upper) of the sampled trees. All leaves of each section were removed and weighed. Thirty leaves were randomly selected in each section, and their fresh mass and area were immediately measured. These leaves were then dried at 65 C and the dry weight of each sub-sample was used in conjunction with its measured area to calculate the specific leaf area (SLA) for each crown section.
- Year collected: 2005-2010
- Study contacts: Jean-Paul Laclau
Fatemi2011
Data from: Fatemi FR, Yanai RD, Hamburg SP, Vadeboncoeur MA, Arthur MA, Briggs RD and Levine CR (2011). Allometric equations for young northern hardwoods: the importance of age-specific equations for estimating aboveground biomass. Canadian Journal of Forest Research, 41, pp. 881-891. DOI: 10.1139/x10-248.
- Site Description
- Site(s) type(s): Temperate forest
- Geography
- latitude, longitude: 44, -71
- Site(s) history: plant grown in field wild
- Experimental or sampling design
- Design characteristics: We sampled six of the major northern hardwood species in the White Mountain National Forest region to determine allometric relationships for small trees. Trees ranged in size from .020-.12 m in diameter at breast height. We sampled 11-12 individuals of each species in the summer of 2004 and 2005. Trees were destructively sampled in the field, and were felled by handsaw or chainsaw. We cut as close to the ground as possible, leaving a stump < 16 cm in height. Trees were typically in co-dominant or dominant positions in the canopy because stands were young (< 30 years since cutting).
- Variables included: age, a.lf, a.stba, a.stbh, h.t, d.ba, d.bh, h.bh, m.lf, m.sb, m.so, m.br
- Species sampled: Acer rubrum, Acer saccharum, Betula alleghaneinsis, Betula papyrifera, Fagus grandifolia, Prunus pensylvanica
- Research methods
- Other variables: Mean annual rainfall provided; Mean annual temperature provided.
- Stand age : Stands ranged from 14-30 years since last cutting (clear-cut) at the time they were sampled.
- Vegetation: Temperate forest: northern hardwood
- Grouping: Refers to stands located within the Bartlett Experimental Forest, under jurisdiction of the United States Forest Service. Stands are part of a larger study entitled Multiple Element Limitation in Northern Hardwood Ecosystems (MELNHE). For more information visit http://www.esf.edu/melnhe/
- Diameter: The diameter of each tree was measured at 1.37 m (diameter at breast height, d.bh), and at the lowest portion of the stem above the ground that could be measured accurately (d.ba).
- Leaf area: Approximately 30g of wet fresh leaves were sub-sampled from each individual tree canopy. Once the tree was felled, we divided the canopy into 3-4 approximately equal length sections. Sub-samples of leaf material were taken from each section proportionately by contribution of leaf mass in each section to total leaf mass for the tree. Leaf area was determined by a LiCor LI-3100 meter.
- Height: Height was measured as the vertical distance from bottom of the felled stem to the highest apex on the tree.
- Stem bark biomass: We weighed the stem with bark in the field. Disks were cut from the stem so that the stem was separated into several portions that were small enough in length (< 2 m) to be weighed in the field,. Stem bark bark was removed from the disks in the laboratory and weighed before and after oven-drying.
- Leaf mass: Foliage, including petioles was weighed in the field; samples were homogenized and sub-sampled for determination of dry weight. Foliage mass also includes the weight of twigs for Betula alleghaneiensis, Betula papyrifera, and Prunus pensylvanica; for other species leaf mass excludes the twigs, and twig weight was considered to be part of the branch weight.
- Branch mass: Note: this value includes bark on branches. Branches were weighed in the field. Branches were divided into three size classes based on average branch basal diameter: small (<1 cm), medium (1-2 cm), and large (>2 cm). Subsamples of branch material were taken from these size classes proportionately by contribution to total branch mass for a totalsubsample mass of 200 g to determine moisture content. Branch weights include the mass of twigs for the following species: Acer saccharum, Acer rubrum, Fagus grandifolia- for all other species, twigs were included in the weight of foliage.
- Aboveground biomass: The sum of biomass of four individual tree components: stem wood, stem bark, branch, foliage. All four components were weighed in the field and sub-sampled for determination of moisture content and dry weight.
- Year collected: 2004-2005
- Study contacts: Farrah Fatemi, Ruth D. Yanai
FLFU1963
Data from: group R (1963). Forest production data from the perspective of material cycle 1. Forestry Laboratories of Kyoto University, Tokyo University, Niigata University and Shinshu University.
- Site Description
- Site(s) type(s): Temperate forest
- Geography
- latitude, longitude: 36, 138; 32.2, 130.8; 36.9, 138.8; 35.2, 140.1
- Site(s) history: plant grown in plantation managed, field wild,
- Experimental or sampling design
- Design characteristics: Sample trees were selected to represent each diameter class or all trees within a plot were felled. Usuda National Forest and Ueda National Forest were surveyed on 25 July to 13 August, 1961. Sumitomo Forestry Co. Forest (stand 6: elevation = 500 m a.s.l., upper slope; slope = 30 degree; stand 3: 200 m, lower slope; stand 7: near stand 6) was surveyed on 23 October to 1 November, 1961. Naeba was surveyed in September 1961. Sample trees were felled at the base, and diameter at breast height, tree height, height of the lowest living branch, and length of longest branch were measured. Sample trees were then treated with the stratified clip technique by cutting them into parts contained in horizontal layers of 0-0.3 m, 0.3-1.3 m, 1.3-2.3 m, and at intervals of 1 m upward. For conifer species, branches and leaves were separated into layers according to the height of whorl branch which branches and leaves are attached. Chiba Forest of Tokyo University was surveyed on 27 November to 2 December 1961 for aboveground and 13-15 December 1961 for root. Trees in this stand were 12-15 years old and regenerated naturally on a land formally used as forest tree nursery. Sample trees were cut into layers based on stem age. Branches and leaves within each layer were further separated based on their ages (current-year, one year, etc.). Only main roots were excavated and weighted. Multiple-stemmed trees were excluded for this data paper.
- Variables included: age, a.lf, a.stbh, a.stbc, h.t, h.c, d.bh, h.bh, c.d, m.lf, m.st, m.so, m.br, m.rt, m.to
- Species sampled: Castanopsis cuspidata, Cinnamomum japonicum, Cleyera japonica, Distylium racemosum, Eurya japonica, Fagus crenata, Larix kaempferi, Pinus densiflora, Quercus myrsinaefolia, Quercus spp.
- Research methods
- Leaf area: Leaf area was estimated for broadleaf species from fresh mass and leaf area per fresh mass which were obtained from a subsample (100-200 g in fresh mass) collected from several sampled trees at each stand.
- Stem cross sectional area: Estimated from stem diameter.
- Height: Measured after sample trees were cut down (Forestry Laboratories of Kyoto University, Tokyo University, Niigata University, and Shinshu University 1963).
- Biomass: Fresh mass of components (stem, branches, and leaves) in each layer were measured. Measured fresh mass was converted to dry mass from the ratio of dry to fresh mass. The ratio was estimated for each stand and each component from a subsample (several hundreds to several thousands g) taken from several sampled trees.
- Other variables: M.I. Ishihara, H. Utsugi, H. Tanouchi, and T. Hiura conducted formal search of reference databases, digitized raw data, and created meta data based on the references (Forestry Laboratories of Kyoto University, Tokyo University, Niigata University, and Shinshu University 1963; Kan et al. 1965 Bull. Kyoto. Univ. For. 37:55-75). Species name and family names were converted by M.I. Ishihara according to the following references: Satake Y, Hara H (1989a) Wild flower of Japan Woody plants I (in Japanese). Heibonsha, Tokyo; Satake Y, Hara H (1989b) Wild flower of Japan Woody plants II (in Japanese). Heibonsha, Tokyo.
- Study contacts: Masae I. Ishihara, Hajime Utsugi, Hiroyuki Tanouchi, Tsutom Hiura
FLFU1965
Data from: group R (1965). Forest production data from the perspective of material cycle 2. Forestry Laboratories of Kyoto University, Tokyo University, Niigata University and Shinshu University.
- Site Description
- Site(s) type(s): Temperate forest
- Geography
- latitude, longitude: 32.83, 132.67; 34.43, 136.73; 35.2, 140.1; 36, 138; 38.3, 139.8
- Site(s) history: plant grown in field wild, plantation managed
- Experimental or sampling design
- Design characteristics: Sample trees were selected to represent each diameter class or all trees within a plot were felled . Quercus phillyreoides dominated stand at Mt. Tsuruba was surveyed in November 1962 (estimated as older than 80 years old, south-west facing, slope of 35 degree, Kan et al. 1965 Bull. Kyoto Univ. For. 37:55-75). Camellia japonica dominated stands in Ise Shrine Forest (compartments 28 and 70) and Quercus glauca-Camellia japonica dominated stand (compartment 32) were surveyed in August 1963 (ca. 300-400 m a.s.l., slope of 25 degree). All three stands were coppice forests regenerated after cutting in 1898. Chiba Forest of Tokyo University was surveyed on 14 November 1962. Suwa was surveyed on 26-31 July 1962. Komagane was surveyed on 11 August 1962. Murakami-Miomote was surveyed on 6-11 August 1962. Sample trees were felled at the base, and diameter at breast height, tree height, height of lowest living branch, and length of longest branch were measured. Sample trees were then treated with the stratified clip technique by cutting them into parts contained in horizontal layers of 0-0.3 m, 0.3-1.3 m, and at intervals of 1 m upward (in some case 2 m intervals). For conifer species, branches and leaves were separated into layers according to the height of whorl branches which branches and leaves are attached. Multiple-stemmed trees were excluded for this data paper.
- Variables included: age, a.lf, a.stbh, a.stbc, h.t, h.c, d.bh, h.bh, c.d, m.lf, m.st, m.so, m.br
- Species sampled: Abies veitchii, Camellia japonica, Cryptomeria japonica, Eurya japonica, Fagus crenata, Illicium anisatum, Ligustrum japonicum, Myrsine seguinii, Podocarpus macrophyllus, Quercus glauca, Quercus phillyreoides
- Research methods
- Leaf area: Leaf area was estimated for broadleaf species from fresh mass and leaf area per fresh mass which were obtained from a subsample (100-200 g in fresh mass) collected from several sampled trees at each stand.
- Stem cross sectional area: Estimated from stem diameter.
- Height: Measured after sample trees were felled.
- Biomass: Fresh mass of components (stem, branches, and leaves) in each layer were measured. Measured fresh mass was converted to dry mass from the ratio of dry to fresh mass. The ratio was estimated for each stand and each component from a subsample (several hundreds to several thousands g) taken from several sampled trees.
- Other variables: M.I. Ishihara, H. Utsugi, H. Tanouchi, and T. Hiura conducted formal search of reference databases, digitized raw data, and created meta data based on the references (Forestry Laboratories of Kyoto University, Tokyo University, Niigata University, and Shinshu University 1965; Kan et al. 1965 Bull. Kyoto Univ. For. 37: 55-75). Species name and family names were converted by M.I. Ishihara according to the following references: Satake Y, Hara H (1989a) Wild flower of Japan Woody plants I (in Japanese). Heibonsha, Tokyo; Satake Y, Hara H (1989b) Wild flower of Japan Woody plants II (in Japanese). Heibonsha, Tokyo.
- Study contacts: Masae I. Ishihara, Hajime Utsugi, Hiroyuki Tanouchi, Tsutom Hiura
Furuno1967
Data from: Furuno T and Kawanabe S (1967). Investigations on the productivity of Japanese fir (Abies firma Sieb. et Zucc.) and hemlock (Tsuga sieboldii Carr.) stands in Kyoto University Forest of Wakayama (I) On the growth of Japanese fir stands. Bulletin of the Kyoto University Forests, 39, pp. 9-26.
- Site Description
- Site(s) type(s): Temperate forest
- Geography
- latitude, longitude: 34.07, 135.53
- Site(s) history: plant grown in field wild
- Experimental or sampling design
- Design characteristics: Survey was conducted in early to mid August 1966 in compartment 9 and 11 (Furuno and Kawanabe 1967). Slopes of these plots were 37 and 35 degrees, respectively. Abies firma and Tsuga sieboldii was overspred with the broadlef species in compartment 9. Abies firma was dominant in compartment 11. Sample trees were selected to represent each diameter class. Sample trees were felled at the base, and diameter at breast height, tree height, height and diameter of the lowest living branch were measured. Sample trees were then treated with the stratified clip technique by cutting them into parts contained in horizontal layers of 1 m thickness. Fresh weight of stem, branches, and leaves in each layer were measured.
- Variables included: a.stbh, h.t, d.bh, h.bh, m.lf, m.st, m.so, m.br
- Species sampled: Abies firma, Tsuga sieboldii
- Research methods
- Height: Method not reported.
- Biomass: Measured fresh weight was converted to dry weight from the ratio of dry to fresh weights. The ratio was estimated from subsamples (Furuno and Kawanabe 1967).
- Other variables: M.I. Ishihara, H. Utsugi, H. Tanouchi, and T. Hiura conducted formal search of reference databases and digitized raw data from Furuno and Kawanabe (1967). Based on this reference, meta data was also created by M.I. Ishihara. Species name and family names were converted by M.I. Ishihara according to the following references: Satake Y, Hara H (1989a) Wild flower of Japan Woody plants I (in Japanese). Heibonsha, Tokyo; Satake Y, Hara H (1989b) Wild flower of Japan Woody plants II (in Japanese). Heibonsha, Tokyo.
- Study contacts: Masae I. Ishihara, Hajime Utsugi, Hiroyuki Tanouchi, Tsutom Hiura
Garber2005
Data from: Garber SM and Maguire DA (2005). The response of vertical foliage distribution to spacing and species composition in mixed conifer stands in central Oregon. Forest Ecology and Management, 211(3), pp. 341-355. DOI: 10.1016/j.foreco.2005.02.053.
- Site Description
- Site(s) type(s): Temperate forest
- Geography
- latitude, longitude: 43.78, -121.65
- Site(s) history: plant grown in plantation managed
- Experimental or sampling design
- Design characteristics: In August and September of 2001, a total of 94 trees was selected for destructive sampling in close proximity to each of the study sites. Trees were selected to match the range in local density, age, size, and species composition corresponding to trees on the study plots and to be mostly free of A. americanum
- Variables included: a.lf, a.ssbh, a.ssbc, a.stbh, a.cp, a.cs, h.t, h.c, d.bh, h.bh, d.cr, c.d, m.lf, m.br
- Species sampled: Abies grandis, Pinus contorta var. latifolia, Pinus ponderosa
- Research methods
- Leaf area: A random subsample of approximately 100 fresh needles was removed in proportion to age class representation on the sample branch. Samples were frozen until measured for projected area (A. grandis) or all-sided area (Pinus species).
- Stem cross sectional area: From diameter outside bark at breast height (1.37 m), DBH (to the nearest 0.1 cm)
- Height: Total tree height measured to the nearest 0.01m
- Crown area: Crown diameter estimated from sample branches. The crown was divided into thirds, and basal diameter, BD (nearest mm), and height of each live branch (nearest 0.01 m) were measured. Two whorl branches that were free of A. americanum, and one interwhorl branch (A. grandis only), were selected at random from each crown third and removed by cutting flush with the bole.
- Biomass: Observed foliage distribution was characterized on the measured plot trees by dividing the crown into 10 segments of equal length and summing the foliage within that segment using branch-level equations.
- Traits: Leaf mass per area was determined for a subsample of foliage as described above under Leaf Area.
- Study contacts: Douglas A. Maguire
Gargaglione2010
Data from: Gargaglione V, Peri PL and Rubio G (2010). Allometric relations for biomass partitioning of Nothofagus antarctica trees of different crown classes over a site quality gradient. Forest Ecology and Management, 259(6), pp. 1118-1126. DOI: 10.1016/j.foreco.2009.12.025.
- Site Description
- Site(s) type(s): Temperate forest
- Geography
- latitude, longitude: -51.56, -72.23
- Site(s) history: plant grown in field wild
- Experimental or sampling design
- Design characteristics: Trees were sampled from an even-age pure stand. Individuals were selected based on a height and location of the live crown in relation to the canopy of surrounding trees. We defined dominant individuals as trees with a majority of the live crown within or above the canopy of surrounding trees. Suppressed trees had majority of the crown located below the canopy of surrounding trees.
- Variables included: status, age, a.stbh, h.t, d.bh, h.bh, m.lf, m.ss, m.sh, m.sb, m.st, m.so, m.br, m.rf, m.rc, m.rt, m.to, n.ss, n.sb, n.sh, n.rf, n.rc
- Species sampled: Nothofagus antarctica
- Research methods
- Stem cross sectional area: Stem cross sectional area was measured at 0.1, 1, DBH and every 1 m to top in two perpendicular directions.
- Height: Total height and diameter at breast height were measured, and stem was cut at 0.1, 1.3 m and every 1 m up to and end diameter of 10 mm after the harvesting.
- Crown area: Crown area was measured using the width and height of the widest point of the crown were measured.
- Biomass: Initial and final diameter of heartwood, sapwood bark and rotten wood were measured at 0.1, 1,3 and every 1 m to calculate wood volume for each component using Smalian formula. Each tree was also separated into: leaves, small branches (<10 mm) with bark, coarse branches with bark (> 10 mm); stem components including sapwood, heartwood and bark. Roots with bark classified as fine (diameter < 2 mm), medium (< 30 mm) or coarse (> 30 mm). Three samples of each component in every tree were taken for biomass calculations (oven dried at 65degC to constant weight) and nutrient analysis. For coarse branches, stem and roots three cross-sectional discs of 30 mm at different lengths were taken and separated into their component pool (heartwood, sapwood, bark and rotten wood) to determinate density for biomass calculations. All small branches, leaves and dead branches from each sampled tree were separated and weighed fresh. Roots from individual trees were excavated to a depth of 0.6 m (maximum rooting depth for all crown classes) in circular plots centred on the stump of selected tress. These roots were sorted in diameter class and weighed in fresh. Sub-samples were taken for oven drying to estimate biomass and for nutrient analysis.
- Year collected: 2006-2007
- Study contacts: Veronica Gargaglione, Pablo Luis Peri
Ghannoum2010a
Data from: Ghannoum O, Phillips NG, Conroy JP, Smith RA, Attard RD, Woodfield R, Logan BA, Lewis JD and Tissue DT (2010). Exposure to preindustrial, current and future atmospheric CO2 and temperature differentially affects growth and photosynthesis in Eucalyptus. Global Change Biology, 16(1), pp. 303-319. DOI: 10.1111/j.1365-2486.2009.02003.x.
- Site Description
- Site(s) type(s):
- Geography
- latitude, longitude: -33.61, 150.75
- Site(s) history: plant grown in glasshouse
- Experimental or sampling design
- Design characteristics: Two eucalyptus species (Eucalyptus saligna and Eucalyptus sideroxylon) were grown at full field capacity under a treatment combination of ambient or elevated temperature (26/18 C or 30/22 C) and subambient, ambient or elevated CO2 (280, 400 or 640 ppm). Seedlings were grown for 150 days from planting, at which time they were subjected to a destructive harvest of all biomass.
- Variables included: a.lf, a.stba, h.t, d.ba, m.lf, m.st, m.so, m.rt, m.to, ma.ilf
- Species sampled: Eucalyptus saligna, Eucalyptus sideroxylon
- Research methods
- Leaf area: All leaves were measured in a leaf area meter (LI-COR 3100, LI-COR, Inc., Lincoln, Nebr.).
- Height: Height was measured as the vertical distance from the pot surface to the highest apex.
- Biomass: All stems, leaves and roots were destructively harvested 150 days after planting, and dried seperately at 80degC for 48h.
- Year collected: 2008-2009
- Study contacts: David Tissue
Ghannoum2010b
Data from: Ghannoum O, Phillips NG, Sears MA, Logan BA, Lewis JD, Conroy JP and Tissue DT (2010). Photosynthetic responses of two eucalypts to industrial-age changes in atmospheric [CO2] and temperature. Plant, Cell & Environment, 33(10), pp. 1671-1681. DOI: 10.1111/j.1365-3040.2010.02172.x.
- Site Description
- Site(s) type(s):
- Geography
- latitude, longitude: -33.61, 150.75
- Site(s) history: plant grown in glasshouse
- Experimental or sampling design
- Design characteristics: Two eucalyptus species (Eucalyptus saligna and Eucalyptus sideroxylon) were grown at full field capacity under a treatment combination of ambient or elevated temperature (26/18 C or 30/22 C) and subambient, ambient or elevated CO2 (280, 400 or 640 ppm). Seedlings were grown for 80 days from planting, at which time they were subjected to a destructive harvest of all biomass.
- Variables included: a.lf, a.stba, h.t, d.ba, m.lf, m.st, m.so, m.rt, m.to, ma.ilf
- Species sampled: Eucalyptus saligna
- Research methods
- Leaf area: All leaves were measured in a leaf area meter (LI-COR 3100, LI-COR, Inc., Lincoln, Nebr.).
- Height: Height was measured as the vertical distance from the pot surface to the highest apex.
- Biomass: All stems, leaves and roots were destructively harvested 80 days after planting, and dried at 80degC for 48 h.
- Year collected: 2008-2009
- Study contacts: David Tissue
Goto2003
Data from: Goto Y, Kominami Y, Miyama T, Tamai K and Kanazawa Y (2003). Aboveground biomass and net primary production of a broad-leaved secondary forest in the southern part of Kyoto prefecture, central Japan. Bulletin of the Forestry and Forest Products Research Institute, 2, pp. 115-147.
- Site Description
- Site(s) type(s): Temperate forest
- Geography
- latitude, longitude: 34.78, 135.83
- Site(s) history: plant grown in field wild
- Experimental or sampling design
- Design characteristics: In the autumn of 1999, 2000, and 2001, 46 trees larger or equal to 3 cm in DBH were harvested in a forest adjacent to the Yamashiro Experimental Forest (Goto et al. 2003). After measuring stem diameter at 0.3 m and 1.3 m above ground, each tree was cut down and separated into stem and branches. Stems were treated with the stratified clip technique by cutting them into parts contained in horizontal layers of 0-0.3 m, 0.3-1.3 m, and at intervals of 1 m upward. Fresh weight of each stem section was measured and subsample was taken to obtain the ratio of dry to fresh weight. Branches were separated into large, medium, small branches, and twigs with leaves and weighted. Subsamples were taken to obtain the ratio of dry to fresh weight. Subsample for twigs with leaves were further separated into current-year leaves, older leaves, current-year branches, older branches, and flowers and fruits, and weighted to obtain the ratio of each component to the total. Fresh weight of each component was obtained from the ratio and the total fresh weight of twigs with leaves. Additionally, 20 trees with DBH larger than or equal to 1 cm and smaller than 3 cm were harvested. After cutting down, DBH and tree height were measured. Fresh weight of stem, branch, current-year leaves, and older leaves were measured. Subsamples were taken for leaves and their areas were measured. For 16 trees, roots were excavated carefully (Dannoura et al. 2006).
- Variables included: age, a.lf, a.stba, a.stbh, a.stbc, h.t, h.c, d.ba, d.bh, h.bh, c.d, m.lf, m.st, m.so, m.br, m.rt, m.to
- Species sampled: Alnus pendula, Castanea crenata, Clethra barbinervis, Cleyera japonica, Eurya japonica, Fraxinus sieboldiana, Ilex crenata, Ilex macropoda, Ilex pedunculosa, Juniperus rigida, Ligustrum japonicum, Lyonia ovalifolia, Mallotus japonicus, Pieris japonica, Pinus densiflora, Pinus thunbergii, Prunus verecunda, Quercus glauca, Quercus serrata, Rhododendron macrosepalum, Rhododendron reticulatum, Vaccinium bracteatum
- Research methods
- Leaf area: Projected leaf area of subsample were measured before oven drying and total leaf area per tree was estimated from SLA and leaf biomass (Goto et al. 2003).
- Stem cross sectional area: Estimated from stem diameter.
- Height: Tree height and height to the lowest living branch were measured after trees were cut down (Goto et al. 2003).
- Biomass: Measured fresh weights of stem, branch, and leaves were converted to dry weight from the ratio of dry to fresh weights (Goto et al. 2003). The ratio was estimated from subsamples which were oven-dried at 95 degrees C. Root dry weight were measured after oven-dried at 95 degrees C for 48 hours (Dannoura et al. 2006).
- Other variables: Root biomass data was reported in Dannoura et al. (2006) and merged to this data by M.I. Ishihara. Species name and family names were converted by M.I. Ishihara according to the following references: Satake Y, Hara H (1989a) Wild flower of Japan Woody plants I (in Japanese). Heibonsha, Tokyo; Satake Y, Hara H (1989b) Wild flower of Japan Woody plants II (in Japanese). Heibonsha, Tokyo.
- Study contacts: Yoshiaki Goto
Hagihara1993
Data from: Hagihara A, Yokota T and Ogawa K (1993). Allometric relations in hinoki (Chamaecyparis obtusa (Sieb. et Zucc.) Endl.) trees. Bulletein of the Nagoya University Forests, 12, pp. 11-29.
- Site Description
- Site(s) type(s): Temperate forest
- Geography
- latitude, longitude: 35, 137; 35.2, 137.57
- Site(s) history: plant grown in field wild
- Experimental or sampling design
- Design characteristics: The allometric relationships between different dimensions of a hinoki (Chamaecyparis obtusa (Sieb. Et Zucc.) Endl.) tree were examined on the basis of 55 destructive samples, which were collected from four different stands and whose age ranged from 12 to 59 years. Only 24 sample trees are reported here. For the rest of 31 trees see Iijima1991, Mori1991, Nakagaki1983, Tanao1982, and Yamaji1991. Biomass and leaf area estimates were determined by the stratified clip technique, in which the stratum was 0.0-0.3 m, 0.3-1.3 m, 1.3-2.3 m, and at intervals of 1 m upward.
- Variables included: age, a.lf, a.stba, a.stbh, h.t, h.c, d.ba, d.bh, h.bh, c.d, m.lf, m.st, m.so, m.br, m.rt, m.to
- Species sampled: Chamaecyparis obtusa
- Research methods
- Leaf area: Leaf area was determined with area meters (Murayama NCE-3, Hayashi AAC-100) on subsamles and was then extrapolatied to total leaf area using specific leaf area from each stratum and summing up each stratum. Specific leaf area was estimated from a sample of leaves used for estimating the ratio of dry/fresh weight and area. Total leaf weight was measured for each stratum.
- Stem cross sectional area: Stem volume (dm3) was based on stem diameters at both ends of the strata (i.e., stem diameter at strata of 0-0.3 m and at final 1 m strata at top of tree).
- Height: Height was measured as the vertical distance from the ground surface to the highest apex of each tree.
- Biomass: Trees were separated into roots, stems, branches and leaves, and then weighed. Sub-samples of the total fresh weight were taken and dried in ventilated ovens at 85 degC for a few days for fresh mass/dry mass estimates. The fresh biomass was converted into dry biomass estimates of roots, stem, branches and leaves per tree using the respective dry/fresh mass ratios.
- Study contacts: Akio Hagihara
Hamilton2005
Data from: Hamilton SD, Brodie G and ODwyer C (2005). Allometric relationships for estimating biomass in grey box (Eucalyptus microcarpa). Australian Forestry, 68(4), pp. 267-273. DOI: 10.1080/00049158.2005.10674976.
- Site Description
- Site(s) type(s): Woodland
- Geography
- latitude, longitude: -36.4, 145.683
- Site(s) history: plant grown in field wild
- Experimental or sampling design
- Design characteristics: A total of 18 trees were sampled for estimation of overstory biomass, and to aid the development of allometric relationships for Eucalyptus microcarpa, across the range of tree sizes found within the area of the Dookie Forest Reserve. Larger trees were oppportunisticly sampled (for example, after storm damage) through the period July 1996 to June 1998, and smaller trees were deliberately felled in July 1996. Sampling strategy entailed treating.
- Variables included: a.stbh, a.cp, h.t, d.bh, h.bh, d.cr, m.lf, m.sb, m.br, m.to
- Species sampled: Eucalyptus microcarpa
- Research methods
- Stem cross sectional area: Stem diameter was measured at 30 cm aboveground, along with the length and diameter of the main stem at its apex.
- Height: Height was measured as the vertical distance from the ground surface to the highest apex of each tree (or stem).
- Crown area: Crown width was measured at right angles, including the widest width.
- Biomass: Harvested material from a given stem was separated into leaves, twigs and branches. Branchwood and branchbark were further separated into individual components. The fresh weight of all material above 20 kg was determined using a weighbridge, while all material under 20 kg was measured on a desktop scale. Sub-samples of all fresh material were taken randomly, then dried to current weight at 80 degC, and the dry weight to fresh weight ratio determined.
- Traits: Wood density was obtained using increment corer samples, and by the water displacement method. Regression equations (for aboveground biomass) were developed by relating the dry weight of individual tree components and total tree aboveground weight to diameter measurements (see Reference article for more details on both).
- Study contacts: Steve Hamilton
Harada1972
Data from: Harada H, Satoo H, Hotta I, Hatiya K and Tadaki Y (1972). Study on the nutrient contents of mature Cryptomeria forest. Bulletin of the Government Forest Experiment Station, 249, pp. 17-74.
- Site Description
- Site(s) type(s): Temperate forest
- Geography
- latitude, longitude: 36, 139.3; 35, 138; 34.9, 138.9; 38, 140; 35.3, 138.9
- Site(s) history: plant grown in plantation managed
- Experimental or sampling design
- Design characteristics: Survey was conducted from 1963 to 1967 in 14 Cryptomeria stands (28-59 years) in 5 regions: Chichibu (Saitama Prefecture, Paleozoic soil), Keta (Shizuoka Prefecture, Mesozoic soil), Amagi (Shizuoka Prefecture, volcanic ash soil), Murakami (Niigata Prefecture, Tertiary soil), and Hakone (Shizuoka Prefecture, volcanic ash soil) (Harada et al. 1972). Diameter at breast height, tree height, and height of the lowest living branch were measured for all living trees in the stands. In each stand, 5-8 sample trees were selected to represent each diameter class. Sample trees were felled and separated into stem, branches, and greenish parts (leaves and green twigs). Branches and greenish parts were treated with the stratified clip technique by cutting them into parts contained in horizontal layers of 2 m thickness. Fresh weights of branches and greenish parts in each layer were measured and subsamples were taken. Subsamples of greenish parts (500-1000 g) were separated into leaves and greenish twigs. Because distinction of leaves from greenish twigs was difficult in Cryptomeria japonica, greenish parts from the tip to the secondary branching were treated as leaves and remaining greenish parts as greenish twigs. Leaves and greenish twigs were weighted to obtain the ratio of leaves or greenish twigs to greenish parts for each stand and each layer. Then, fresh weight of leaves or greenish twigs was estimated from this ratio and fresh weight of greenish parts. Fresh weight of stem was measured directly or estimated from volume and the ratio of fresh weight to volume of subsamples. Roots of two to three trees per stand were excavated from plots centered on the stump of sampled tress. Area of a plot was equivalent or half of the mean occupancy area of a tree. Roots were separated into layers and further into main, coarse (diameter >= 2 cm), medium (0.2-2 cm), fine (< 0.2 cm) roots and weighted.
- Variables included: age, a.stbh, h.t, h.c, d.bh, h.bh, c.d, m.lf, m.st, m.so, m.br, m.rt, m.to
- Species sampled: Cryptomeria japonica
- Research methods
- Height: Method not recorded.
- Biomass: Measured fresh mass was converted to dry mass from the ratio of dry to fresh mass (Harada et al. 1972). The ratio for branches or green parts was estimated for each stand and each layer from subsample (500-1000 g). The ratio for root was estimated for each stand, each layer, and each root size class from subsample (500-1000 g).
- Other variables: M.I. Ishihara, H. Utsugi, H. Tanouchi, and T. Hiura conducted formal search of reference databases and digitized raw data from Harada et al. (1972). Based on this reference, meta data was also created by M.I. Ishihara. Species name and family names were converted by M.I. Ishihara according to the following references: Satake Y, Hara H (1989a) Wild flower of Japan Woody plants I (in Japanese). Heibonsha, Tokyo; Satake Y, Hara H (1989b) Wild flower of Japan Woody plants II (in Japanese). Heibonsha, Tokyo.
- Study contacts: Masae I. Ishihara, Hajime Utsugi, Hiroyuki Tanouchi, Tsutom Hiura
Harja2012
Data from: Harja D, Vincent G, Mulia R and van Noordwijk M (2012). Tree shape plasticity in relation to crown exposure. Trees - Structure and Function, 26, pp. 1275-1285. DOI: 10.1007/s00468-012-0703-x.
- Site Description
- Site(s) type(s): Tropical rainforest
- Geography
- latitude, longitude: -1.590796, 102.2486; 0.133724, 110.6037; -2.923754, 104.5422; -6.563922, 106.6318
- Site(s) history: plant grown in field wild
- Experimental or sampling design
- Design characteristics: The data were sampled in contrasting environments across the lowlands of Sumatra, Java and Kalimantan (Indonesia) and there were no specific observation plot located. The trees were sampled individually
- Variables included: status, light, a.stbh, a.cp, h.t, h.c, d.bh, h.bh, d.cr, c.d, r.st
- Species sampled: Acacia mangium, Albizia falcataria, Alstonia scholaris, Archidendron jiringa, Durio zibethinus, Fagraea fragrans, Hevea brasiliensis, Lansium domesticum, Schima wallichii, Shorea stenoptera
- Research methods
- Height: The tree height was measured using Timber cruising altimeter carl leiss blume-leiss
- Study contacts: Degi Harja
Haruki1979
Data from: Haruki M (1979). Studies on the material biomass of Abies sachalinensis artificial forest. Research bulletin of the Hokkaido University Forests, 36, pp. 147-247.
- Site Description
- Site(s) type(s): Boreal forest, Temperate forest
- Geography
- latitude, longitude: 45, 142; 42.7, 141.6
- Site(s) history: plant grown in plantation managed, field wild
- Experimental or sampling design
- Design characteristics: Sampling was conducted in 12 Abies sachalinensis plantations in Teshio and Tomakomai Experimental Forests, Hokkaido University, Hokkaido, Japan. Stand ages and the data of sampling were: stand 1-2: 11 years old, June and August of 1972; stand 3: 11 years, Sep. 1974; stand 4: 18 years, Nov. 1973; stand 5: 38 years, Sep. 1972; stand 6 : 9 years, Oct. 1974; stand 7-9: 12 years, Sep. 1972; stand 10: 35 years, Dec. 1972; stand 11: ca. 15 years, July 1976; 12: 30-34 years, July 1976. In addition, sampling was conducted in plot 13 in Teshio Experimental Forest, a naturally regenerated ca. 30 year-old A. sachalinensis stand in July 1976. Stand 11-13 were selected to study suppressed trees. Sample trees were selected either to cover size ranges or to represent the average size. Sample trees were cut at ground level. Tree height, height of the lowest living branch, and stem diameters at breast height were measured. Sample trees were then cut into two parts at the height of the lowest living branch. Crown was further cut into whorl strata defined by whorls. For each stratum, needles and branches were separated from the stem.
- Variables included: a.stba, a.stbh, h.t, d.ba, d.bh, h.bh, m.lf, m.st, m.so, m.br
- Species sampled: Abies sachalinensis
- Research methods
- Stem cross sectional area: Estimated from stem diameter.
- Height: Measured after trees were cut.
- Biomass: Fresh mass of stem and needles + branches were measured for each stratum. Stems were oven-dried at 90 degC and weighted for dry mass. For stand 5 and 10, dry mass was estimated from fresh mass and the ratio of dry to fresh mass which was obtained from a disc collected for each stratum. Needle fresh mass and branch fresh mass of each whorl stratum were estimated from the needle+branch fresh mass and the ratio of needle to branch mass specific for each stratum. The ratio was estimated from subsamples taken from the stratum. Fresh mass was converted to dry mass by the stratum-specific ratio of dry to fresh mass which was obtained from subsamples. Amount of subsample for the conversion ratio was about 10 % of the total fresh mass within the stratum.
- Other variables: M.I. Ishihara, H. Utsugi, H. Tanouchi, and T. Hiura conducted formal search of reference databases and digitized raw data from Haruki (1979). Based on this reference, meta data was also created by M.I. Ishihara. Species name and family names were converted by M.I. Ishihara according to the following references: Satake Y, Hara H (1989a) Wild flower of Japan Woody plants I (in Japanese). Heibonsha, Tokyo; Satake Y, Hara H (1989b) Wild flower of Japan Woody plants II (in Japanese). Heibonsha, Tokyo.
- Study contacts: Masae I. Ishihara, Hajime Utsugi, Hiroyuki Tanouchi, Tsutom Hiura
Hashizume1980
Data from: Hashizume H and Onishi Y (1980). On the production structure and productivity of beech forests in the Hiruzen district. Hardwood research, 1, pp. 73-84.
- Site Description
- Site(s) type(s): Temperate forest
- Geography
- latitude, longitude: 35.3, 133.6
- Site(s) history: plant grown in field wild
- Experimental or sampling design
- Design characteristics: Survey was conducted in the summer of 1978 (Hashizume and Onishi 1980). Sample trees were selected to represent each diameter class and were felled. Diameter at breast height, tree height, and height of the lowest living branch were measured. Sample trees were treated with the stratified clip technique by cutting them into parts contained in horizontal layers of 0-0.3 m, 0.3-1.3 m, 1.3-2.3 m, and at intervals of 1 m upward.
- Variables included: age, a.stbh, h.t, h.c, d.bh, h.bh, c.d, m.lf, m.st, m.so, m.br
- Species sampled: Fagus crenata
- Research methods
- Height: Measured after sample trees were felled (Hashizume and Onishi 1980).
- Biomass: Fresh mass of stem, branches, leaves, and fruits in each layer were measured. Measured fresh mass was converted to dry mass from the ratio of dry to fresh mass (Hashizume and Onishi 1980). The ratio was estimated from subsamples from each layer.
- Other variables: M.I. Ishihara, H. Utsugi, H. Tanouchi, and T. Hiura conducted formal search of reference databases and digitized raw data from Hashizume and Onishi (1980). Based on this reference, meta data was also created by M.I. Ishihara. Species name and family names were converted by M.I. Ishihara according to the following references: Satake Y, Hara H (1989a) Wild flower of Japan Woody plants I (in Japanese). Heibonsha, Tokyo; Satake Y, Hara H (1989b) Wild flower of Japan Woody plants II (in Japanese). Heibonsha, Tokyo.
- Study contacts: Masae I. Ishihara, Hajime Utsugi, Hiroyuki Tanouchi, Tsutom Hiura
Hashizume1985
Data from: Hashizume H (1985). Studies on the improvement of the secondary forest of broad-leaved trees (II) The effect of improvement cutting and manuring on the growth of the secondary forest of Kunugi (Quercus acutissima Carruth.) . Bulletin of the Faculty of Agriculture, Tottori University, 38, pp. 60-67.
- Site Description
- Site(s) type(s): Temperate forest
- Geography
- latitude, longitude: 35.3, 133.6
- Site(s) history: plant grown in field wild
- Experimental or sampling design
- Design characteristics: Survey was conducted in three plots in a secondary oak forest about 40-years old in August 1984 (Hashizume 1985). Two plots were heavily thinned in 1978 to make them into Quercus acutissima dominant stands and the density was 600 trees/ha in 1984. Fertilizer of 3-5 kg/tree (N: P: K = 13: 17: 12, %; 900-1500 kg/ha) was applied to one of two plots for three years after thinning. Third plot was untreated control with density of 800-1000 trees/ha in 1984. After 6 years, in 1984, 15 sample trees, 5 from each plot, were selected to represent averaged size. Method of biomass measurement was the same as Hashizume and Kodani (1985, Studies on the improvement of the secondary forest of broad-leaved trees (I) The effect of improved cutting on the growth of the secondary forest of Buna (Fagus crenata Blume). Bull. Fac.Agric. Tottori Univ. 38: 51-59). Sample trees were felled after the measurement of diameter at breast height, tree height, and height of the lowest living branch.
- Variables included: age, a.stbh, a.cp, h.t, h.c, d.bh, h.bh, d.cr, c.d, m.lf, m.st, m.so, m.br
- Species sampled: Quercus acutissima
- Research methods
- Height: Measured before sample trees were felled (Hashizume and Kodani 1985).
- Biomass: Fresh mass of stem, branches, leaves, and fruits were measured. Measured fresh mass was converted to dry mass from the ratio of dry to fresh mass (Hashizume and Kodani 1985). The ratio was estimated from subsamples which were oven-dried at 100 degrees C.
- Other variables: M.I. Ishihara, H. Utsugi, H. Tanouchi, and T. Hiura conducted formal search of reference databases and digitized raw data from Hashizume (1985). Based on this reference, meta data was also created by M.I. Ishihara. Species name and family names were converted by M.I. Ishihara according to the following references: Satake Y, Hara H (1989a) Wild flower of Japan Woody plants I (in Japanese). Heibonsha, Tokyo; Satake Y, Hara H (1989b) Wild flower of Japan Woody plants II (in Japanese). Heibonsha, Tokyo.
- Study contacts: Masae I. Ishihara, Hajime Utsugi, Hiroyuki Tanouchi, Tsutom Hiura
Holdaway2008
Data from: Holdaway RJ, Allen RB, Clinton PW, Davis MR and Coomes DA (2008). Intraspecific changes in forest canopy allometries during self-thinning. Functional Ecology, 22, pp. 460-469. DOI: 10.1111/j.1365-2435.2008.01388.x.
- Site Description
- Site(s) type(s): Temperate forest
- Geography
- latitude, longitude: -43.15, 171.35
- Site(s) history: plant grown in field wild
- Experimental or sampling design
- Design characteristics: Leaf area and weight data collected for 87 Nothofagus solandri individuals at Craigieburn, South Island, New Zealand. Data collected January to April 2007 from three distinct age classes (25, 40 and 135 years old). All stands were located on similar slopes, aspects and altitudes
- Variables included: age, a.lf, a.stba, a.stbh, h.t, d.ba, d.bh, h.bh, m.lf, a.ilf, ma.ilf
- Species sampled: Nothofagus solandri
- Research methods
- Leaf area: Each tree was divided into 1m height classes. A subsample of 100 fresh leaves from each height class was used for determination of leaf area using ImageJ software and specific leaf area was used to estimate total leaf area per height class and per tree.
- Leaf biomass: For each height class leaf biomass was determined by drying the leaf component (including petioles) at 60 degC for at least three days and weighing all material per height class. Sor some the leaf biomass was determined through weighing branches with leaves still attached and calculating the leaf biomass through a known leaf to branch ratio. Total leaf biomass was attained by summation of all height classes.
- Leaf mass per area: LMA calculated as the average across the entire plant
- Individual leaf area: Average leaf area for an individual leaf was aceraged across the entire plant
- Stem cross sectional area: Stem diameter was measured at ground using calliper at right angles, and at breast height (1.35m) using stem diameter tape
- Height: Height was measured as the vertical distance from the ground to the highest apex.
- Other variables: Further data exist on the stand development sequence from which these data were obtained. See Holdaway et al. 2008 Functional Ecology 22: 460-469 and references therein.
- Year collected: 2007
- Study contacts: Robert Holdaway
Iijima1991
Data from: Iijima K (1991). Growth of the stem volume of hinoki trees. Masters thesis, Faculty of Agriculture, Nagoya University, Japan.
- Site Description
- Site(s) type(s): Temperate forest
- Geography
- latitude, longitude: 35.1, 137.5
- Site(s) history: plant grown in plantation managed
- Experimental or sampling design
- Design characteristics: The allometric relationships between different dimensions of a hinoki (Chamaecyparis obtusa (Sieb. Et Zucc.) Endl.) tree were examined on the basis of 55 destructive samples, which were collected from four different stands and whose age ranged from 12 to 59 years (Hagihara1993). Only 5 sample trees are reported here. For the rest of 50 trees see Hagihara1993, Mori1991, Nakagaki1983, Tanao1982, and Yamaji1991. Biomass and leaf area estimates were determined by the stratified clip technique, in which the stratum was 0.0-0.3 m, 0.3-1.3 m, 1.3-2.3 m, and at intervals of 1 m upward.
- Variables included: age, a.lf, a.stbh, a.stbc, h.t, h.c, d.bh, h.bh, c.d, m.lf, m.st, m.so, m.br
- Species sampled: Chamaecyparis obtusa
- Research methods
- Leaf area: Leaf area was determined with area meters (Murayama NCE-3, Hayashi AAC-100, Hayashi AAM-5) on subsamles and was then extrapolatied to total leaf area using specific leaf area from each stratum and summing up each stratum. Specific leaf area was estimated from a sample of leaves used for estimating the ratio of dry/fresh weight and area. Total leaf weight was measured for each stratum.
- Stem cross sectional area: Estimated from stem diameter.
- Height: Height was measured as the vertical distance from the ground surface to the highest apex of each tree.
- Biomass: Trees were separated into roots, stems, branches and leaves, and then weighed. Sub-samples of the total fresh weight were taken and dried in ventilated ovens at 85 degC for a few days for fresh mass/dry mass estimates. The fresh biomass was converted into dry biomass estimates of roots, stem, branches and leaves per tree using the respective dry/fresh mass ratios.
- Study contacts: Akio Hagihara
Ikushima1964
Data from: Ikushima T (1964). Productive structure of woody community. Academic report of Tanzawa Oyama, Kanagawa Prefecture.
- Site Description
- Site(s) type(s): Temperate forest
- Geography
- latitude, longitude: 35.5, 139
- Site(s) history: plant grown in field wild
- Experimental or sampling design
- Design characteristics: Sample trees were selected in two locations (800-1200 m a.s.l.) to represent wide diameter ranges in August 1962 (Ikushima 1964). After trees were felled, diameter at breast height and tree height were measured.
- Variables included: a.lf, a.stbh, d.bh, h.bh, m.lf, m.so
- Species sampled: Acer amoenum, Acer tschonoskii, Carpinus japonica, Clethra barbinervis, Fagus crenata, Fagus japonica, Lindera praecox, Lindera umbellata, Pieris japonica, Rhododendron dilatatum, Rhododendron obtusum, Viburnum furcatum, Weigela decora
- Research methods
- Leaf area: Leaf area was estimated from subsamples (Ikushima 1964).
- Height: Measured but not reported.
- Biomass: Fresh mass of stem, branches, and leaves were measured. Measured fresh mass was converted to dry mass from the ratio of dry to fresh mass (Ikushima 1964). The ratio was estimated from subsamples taken for each tree. For several large-sized trees, fresh mass of stems were estimated from stem volume.
- Other variables: M.I. Ishihara, H. Utsugi, H. Tanouchi, and T. Hiura conducted formal search of reference databases and digitized raw data from Ikushima (1964). Based on this reference, meta data was also created by M.I. Ishihara. Species name and family names were converted by M.I. Ishihara according to the following references: Satake Y, Hara H (1989a) Wild flower of Japan Woody plants I (in Japanese). Heibonsha, Tokyo; Satake Y, Hara H (1989b) Wild flower of Japan Woody plants II (in Japanese). Heibonsha, Tokyo.
- Study contacts: Masae I. Ishihara, Hajime Utsugi, Hiroyuki Tanouchi, Tsutom Hiura
Ilomaki2003
Data from: Ilomäki S, Nikinmaa E and Mäkelä A (2003). Crown rise due to competition drives biomass allocation in silver birch. Canadian Journal of Forest Research, 33(12), pp. 2395-2404. DOI: 10.1139/x03-164.
- Site Description
- Site(s) type(s): Boreal forest
- Geography
- latitude, longitude: 62.33, 27.86
- Site(s) history: plant grown in field experimental
- Experimental or sampling design
- Design characteristics: Eighteen sample trees were felled and measured in August 1999. Trees in sample plots were classified as dominant and nondominant on the basis of crown size and position in canopy. The trees in each plot and each class were ordered by basal area, the cumulative basal area of the ordered series was divided into three equal classes and one sample tree was picked randomly from each third except in the dense plot where two nondominant sample trees were picked from each three classes. This yielded three, six, and nine sample trees from the sparse, medium, and dense plot, respectively, and included nine dominant and nine nondominant trees.
- Variables included: status, age, a.stbh, h.t, h.c, d.bh, h.bh, c.d, m.lf, m.st, m.so, m.br
- Species sampled: Betula pendula
- Research methods
- Leaf area: Leaf area estimate was based on leaf biomass (see below) and specific leaf area. SLA (projected) was measured on sample leaves (12.5 m2/kg).
- Stem cross sectional area: Stem cross sectional area was determined from sample disks taken at breast height (1.3 m) and at crown base. The cross section was calculated as a circle with radius equalling the average of the largest diameter and that perpendicular to it.
- Height: Height was measured using a tape measure on the felled trees. Breast height was recorded before felling and the part of the stem above breast height was added to 1.3 m to obtain the total height.
- Height to crown base: Crown base was recorded as the height of the lowest live branch; however, single branches more than 1 m below the uniform live crown were not included in the crown. Crown base height was measured after felling (see height).
- Diameter: Diameter at breast height (over bark) was measured with a calliper before felling as an average of two perpedicular measurements.
- Crown area: Before felling, the width of the crown was measured at the widest diameter and the one perpendicular to that. Crown area can be approximated using this and crown length, measured using a tape measure after felling.
- Biomass: Branches were sampled systematically from each tenth of the crown length and discs were taken from the stem at a number of heights, all including breast height and crown base. Stand-wise regression model were developed for the sample branches to estimate leaf and branch dry mass from branch diameter and distance from the tree top, which were measured from all live branches in the crown. Stem volume was calculated from the logs between the disc measurement heights by assuming the logs as cut cones. The volume was converted to stem biomass using wood density of the lower disc of each log, obtained by weighing and immersion of the disc.
- Year collected: 1999
- Study contacts: Annikki Mäkelä
Ishii2000
Data from: Ishii H and Tadaki Y (2000). Structure and biomass of a secondary broad-leaved forest growing in the campus of Nagoya University. Nagoya University forest science, 19, pp. 197-206.
- Site Description
- Site(s) type(s): Temperate forest
- Geography
- latitude, longitude: 35.152, 136.97
- Site(s) history: plant grown in field wild
- Experimental or sampling design
- Design characteristics: Survey was conducted in June-August 1995 in a secondary broadleaved forest (60 m a.s.l.) dominated by Quercus such as Q. serrate and Q. variabilis (Ishii and Tadaki 2000). All trees in a 15 times 10 m plot were felled. Stem diameter at 0, 0.3, 1.3 m and at intervals of 1 m upward, tree height, height of the lowest living branch, height of lowest leaf, and crown diameter were measured. Sample trees were treated with the stratified clip technique by cutting them into parts contained in horizontal layers of 1 m depth.
- Variables included: a.lf, a.stbh, h.t, d.bh, h.bh, m.lf, m.st, m.so, m.br
- Species sampled: Eurya japonica, Ilex pedunculosa, Ligustrum japonicum, Lyonia ovalifolia, Quercus glauca, Quercus serrata, Quercus variabilis, Rhododendron macrosepalum, Rhus trichocarpa, Sorbus alnifolia, Vaccinium bracteatum, Viburnum dilatatum
- Research methods
- Leaf area: Leaf area was estimated from subsamples (Ishii and Tadaki 2000).
- Height: Measured after trees were felled (Ishii and Tadaki 2000).
- Biomass: Fresh mass of stem, branches, leaves, and fruits in each layer were measured. Measured fresh mass was converted to dry mass from the ratio of dry to fresh mass (Ishii and Tadaki 2000). The ratio was estimated from subsamples taken from each layer.
- Other variables: M.I. Ishihara, H. Utsugi, H. Tanouchi, and T. Hiura conducted formal search of reference databases and digitized raw data from Ishii and Tadaki (2000). Based on this reference, meta data was also created by M.I. Ishihara. Species name and family names were converted by M.I. Ishihara according to the following references: Satake Y, Hara H (1989a) Wild flower of Japan Woody plants I (in Japanese). Heibonsha, Tokyo; Satake Y, Hara H (1989b) Wild flower of Japan Woody plants II (in Japanese). Heibonsha, Tokyo.
- Study contacts: Masae I. Ishihara, Hajime Utsugi, Hiroyuki Tanouchi, Tsutom Hiura
Kabaya1968
Data from: Kabaya H and Sato T (1968). Estimation of the biomass, growth and nitrogen biomass in Pinus thunbergii forest. Bulletin of the Japanese Forestry Society, 79, pp. 93-94.
- Site Description
- Site(s) type(s): Temperate forest
- Geography
- latitude, longitude: 34.68, 137.57
- Site(s) history: plant grown in plantation managed
- Experimental or sampling design
- Design characteristics: Survey was conducted in October 1967 in a Pine forest (33-34 year old) in Shizuoka Prefecture (Kabaya and Satoo 1968). All trees in a 41.8-square-meter plot were felled.
- Variables included: a.stbh, h.t, d.bh, h.bh, m.lf, m.st, m.so, m.br
- Species sampled: Pinus thunbergii
- Research methods
- Height: Methods not reported.
- Biomass: Methods not reported.
- Other variables: M.I. Ishihara, H. Utsugi, H. Tanouchi, and T. Hiura conducted formal search of reference databases and digitized raw data from Kabaya and Satoo (1968). Based on this reference, meta data was also created by M.I. Ishihara. Species name and family names were converted by M.I. Ishihara according to the following references: Satake Y, Hara H (1989a) Wild flower of Japan Woody plants I (in Japanese). Heibonsha, Tokyo; Satake Y, Hara H (1989b) Wild flower of Japan Woody plants II (in Japanese). Heibonsha, Tokyo.
- Study contacts: Masae I. Ishihara, Hajime Utsugi, Hiroyuki Tanouchi, Tsutom Hiura
Kabaya1981
Data from: Kabaya H (1981). Causal analyses of poor growth observed at the inner part of the pine plantations on costal sand dune. Bulletin of the Tokyo University Forests, 70, pp. 11-80.
- Site Description
- Site(s) type(s): Temperate forest
- Geography
- latitude, longitude: 34.68, 137.57; 35.31, 139.8; 35.739, 139.538; 35.2, 140.1
- Site(s) history: plant grown in plantation managed, field wild
- Experimental or sampling design
- Design characteristics: Harvest in Arai Experimental station was conducted in November 1969 at 5 Pinus thunbergii plantation plots (Kabaya 1981). Two plots were fertilized (F1 and F2) in 1967 with ammonium sulfate (250 kg/ha as N amount) and saw dust compost and in 1968, 1969, 1970 by ammonium sulfate (50 kg/ha as N amount). Two plots were control (C1 and C2). Litter was removed from one plot (R1) four times a year since 1967. All plots were 33-34 years old in 1967. Harvest in Futtsu sea coast was conducted in December 1968 at one fertilized (NKP) and one control (C2) plots. Both plots were planted with P. thunbergii in 1952 and 18 years old in 1966. Fertilized plot (NKP) was fertilized with ammonium nitrate, ammonium phosphate, and potassium chloride (1 kg/a as N, 1.2kg/a as P2O5, and 3 kg/a as K) in 1966. Additionally, this plot was fertilized with ammonium phosphate (1 kg/a as N) in 1967 and 1968. Harvest in a 33 year-old P. thunbergii plantation plot in Tanashi Experimental Field was conducted in October 1968. Harvest in a 22-23 year-old plot in a naturally regenerated P. thunbergii stand of Chiba Forest of Tokyo University was conducted in November 1968. The plot was facing southwest with a slope of 35-36 degrees. Two to five sample trees were felled from each plot. Sample trees were then treated with the stratified clip technique by cutting them into parts contained in horizontal layers of 2 m depth. Roots in a 1-m radius from the stump of a sampled tree were excavated.
- Variables included: age, a.stba, a.stbh, h.t, d.ba, d.bh, h.bh, m.lf, m.st, m.so, m.br, m.rt, m.to
- Species sampled: Pinus thunbergii
- Research methods
- Height: Methods not reported in Kabaya (1981).
- Biomass: Fresh weight of stem, branches, and needles in each layer were measured. Branches and needles were further separated based on their ages (current-year, one year, second year, and others). Subsamples of each organ were taken and oven-dried at 80 degrees C (Kabaya 1981). The dry-to-fresh weight ratios of these subsamples were used to calculate total dry weight of each tree component.
- Other variables: M.I. Ishihara, H. Utsugi, H. Tanouchi, and T. Hiura conducted formal search of reference databases and digitized raw data from Kabaya (1981). Based on this reference, meta data was also created by M.I. Ishihara. Species name and family names were converted by M.I. Ishihara according to the following references: Satake Y, Hara H (1989a) Wild flower of Japan Woody plants I (in Japanese). Heibonsha, Tokyo; Satake Y, Hara H (1989b) Wild flower of Japan Woody plants II (in Japanese). Heibonsha, Tokyo.
- Study contacts: Masae I. Ishihara, Hajime Utsugi, Hiroyuki Tanouchi, Tsutom Hiura
Kantola2004
Data from: Kantola A and Mäkelä A (2004). Crown development in Norway spruce [Picea abies (L.) Karst.]. Trees - Structure and Function, 18(4), pp. 408-421. DOI: 10.1007/s00468-004-0319-x.
- Site Description
- Site(s) type(s): Boreal forest
- Geography
- latitude, longitude: 61.18333, 26.18333; 61.81667, 29.31667; 60.65, 27.16667
- Site(s) history: plant grown in field experimental
- Experimental or sampling design
- Design characteristics: In the young stand (Lapinjärvi), 5 trees were sampled from an unthinned plot, while in each of the two older stands (Heinola and Punkaharju), a total of 12 trees were sampled from 3 plots with different thinning treatments, including unthinned control (5 trees sampled), normal commercial thinning (4 trees sampled), and intensive thinning (3 trees sampled). The trees were sampled according to the stem cumulative basal area distribution in each plot (more accurate description in the article).
- Variables included: a.stbh, a.cp, h.t, h.c, d.bh, h.bh, d.cr, c.d, m.lf, m.br
- Species sampled: Picea abies
- Research methods
- Stem cross sectional area: Calculated by stem diameter at the base of the living crown. The stem measured in two directions using a slide gauge.
- Height: The sample trees were felled and tree height was measured by tape measure from the base of the trunk to the tip of the crown.
- Crown area: This was projected crown area and was estimated as a circle by the measurements of the crown width (Crown width was measured in two directions; the maximum width and the width perpendicular to it).
- Biomass: The foliage and branch wood biomasses were estimated for each branch in the crown using the measurements of ten randomly sampled branches. The fresh sample branches were measured in the field and then oven dried. The dry mass of needles and branch wood was then determined. The stem basic density estimated from five sample discs (at crown base, 1.3 m, 30%, 70%, and 90% height). The randomly cut sample sectors were separated into sapwood, heartwood and bark fragments, which were measured for volume by immersion, and then oven dried and weighed.
- Study contacts: Anu Kantola, Annikki Mäkelä
Karizumi1984
Data from: Karizumi N and Terada M (1984). Root structure in a Chamaecyparis obtusa forest. Bulletin of the Japanese Forestry Society, 95, pp. 337-338.
- Site Description
- Site(s) type(s): Temperate forest
- Geography
- latitude, longitude: 36.3, 140.13
- Site(s) history: plant grown in plantation managed
- Experimental or sampling design
- Design characteristics: Harvest was conducted in a 31-year-old Chamaecyparis obtusa forest in August 1983 (Karizumi and Terada 1984). Sample trees were selected to represent each diameter class. Roots were excavated, separated into soil depth and into very large (diameter >= 5 cm), large (2-5 cm), medium (0.5-2 cm), small (0.2-0.5 cm), fine (< 0.2 cm) roots, and weighted. Fine and small roots were estimated by soil block sampling method.
- Variables included: age, a.stbh, h.t, d.bh, h.bh, m.lf, m.st, m.so, m.br, m.rt, m.to
- Species sampled: Chamaecyparis obtusa
- Research methods
- Height: Method not reported in Karizumi and Terada (1984)
- Biomass: Method not reported in Karizumi and Terada (1984),
- Other variables: M.I. Ishihara, H. Utsugi, H. Tanouchi, and T. Hiura conducted formal search of reference databases and digitized raw data from Karizumi and Terada (1984). Based on this reference, meta data was also created by M.I. Ishihara. Species name and family names were converted by M.I. Ishihara according to the following references: Satake Y, Hara H (1989a) Wild flower of Japan Woody plants I (in Japanese). Heibonsha, Tokyo; Satake Y, Hara H (1989b) Wild flower of Japan Woody plants II (in Japanese). Heibonsha, Tokyo.
- Study contacts: Masae I. Ishihara, Hajime Utsugi, Hiroyuki Tanouchi, Tsutom Hiura
Katagiri1984
Data from: Katagiri S, Ishii H, Miyake N and Ando Y (1984). Studies on mineral cycling in a deciduous broad-leaved forest at Sanbe Forest of Shimane University (XII): Difference of above ground biomass in a deciduous broad-leaved forest along a slope. Bulletin of the Faculty of Agriculture, Shimane University, 18, pp. 53-60.
- Site Description
- Site(s) type(s): Temperate forest
- Geography
- latitude, longitude: 35.2, 132.7
- Site(s) history: plant grown in field wild
- Experimental or sampling design
- Design characteristics: Harvest was conducted in a 3 0.01-ha subplots (10 m times 10 m) in a broadleaf forest plot (20 m times 95 m) at Sanbe Forest of Shimane University in August 1983 (Katagiri et al. 1984). All trees with diameter >= 4.8 cm were felled. Additionally, three trees with diameter >= 25 cm were felled from other plots. Trees felled in 1976 and 1982 were also reported. After felling, stem diameters at breast height, tree height, and height of the lowest living branch were measured.
- Variables included: age, a.stbh, h.t, d.bh, h.bh, m.lf, m.st, m.so, m.br
- Species sampled: Acer rufinerve, Albizia julibrissin, Benthamidia japonica, Carpinus laxiflora, Carpinus tschonoskii, Castanea crenata, Clethra barbinervis, Ilex macropoda, Ilex pedunculosa, Magnolia obovata, Pieris japonica, Prunus jamasakura, Quercus acutissima, Quercus serrata, Styrax japonica, Styrax obassia, Swida controversa, Swida macrophylla
- Research methods
- Height: Method was not reported in Katagiri et al. (1984).
- Biomass: Fresh weights of stem, branches, and leaves were measured. Detailed method was not reported in Katagiri et al. (1984).
- Other variables: M.I. Ishihara, H. Utsugi, H. Tanouchi, and T. Hiura conducted formal search of reference databases and digitized raw data from Katagiri et al. (1984). Based on this reference, meta data was also created by M.I. Ishihara. Species name and family names were converted by M.I. Ishihara according to the following references: Satake Y, Hara H (1989a) Wild flower of Japan Woody plants I (in Japanese). Heibonsha, Tokyo; Satake Y, Hara H (1989b) Wild flower of Japan Woody plants II (in Japanese). Heibonsha, Tokyo.
- Study contacts: Masae I. Ishihara, Hajime Utsugi, Hiroyuki Tanouchi, Tsutom Hiura
Katakura2007
Data from: Katakura M, Yamauchi M and Koyama Y (2007). Biomass and carbon stock in Larix, Pinus, and Quercus forests and the changes in soil carbon after clear cut of a Pinus forest. Bulletin of the Nagano Prefecture Forestry Research Center, 22, pp. 33-55.
- Site Description
- Site(s) type(s): Temperate forest
- Geography
- latitude, longitude: 36.144, 138; 36.143, 137.999
- Site(s) history: plant grown in field wild
- Experimental or sampling design
- Design characteristics: Harvest in stand 6, 7, 8, and 9 were conducted in August 2001, November 2001, October 2006, July 2004, respectively (Katakura et al. 2007). All stands were secondary forest. Sample trees were selected to cover diameter range. Sample trees were then treated with the stratified clip technique by cutting them into parts contained in horizontal layers of 1 m depth.
- Variables included: a.stbh, h.t, h.c, d.bh, h.bh, c.d, m.lf, m.st, m.so, m.br, m.rt, m.to
- Species sampled: Pinus densiflora, Quercus serrata
- Research methods
- Height: Method not reported in Katakura et al. (2007).
- Biomass: Samples were oven-dried at 80 degrees C for 72 hours and dry weights were measured (Katakura et al. 2007).
- Other variables: M.I. Ishihara, H. Utsugi, H. Tanouchi, and T. Hiura conducted formal search of reference databases and digitized raw data from Katakura et al. (2007). Based on this reference, meta data was also created by M.I. Ishihara. Species name and family names were converted by M.I. Ishihara according to the following references: Satake Y, Hara H (1989a) Wild flower of Japan Woody plants I (in Japanese). Heibonsha, Tokyo; Satake Y, Hara H (1989b) Wild flower of Japan Woody plants II (in Japanese). Heibonsha, Tokyo.
- Study contacts: Masae I. Ishihara, Hajime Utsugi, Hiroyuki Tanouchi, Tsutom Hiura
Kato1973
Data from: Kato R and Segawa K (1973). Growth and primary productivity of Kobanoyamahannoki (Alnus Inokumai Murai et Kusaka) stand at Mamurogawa experimental plot. Bulletin of the Forestry and Forest Products Research Institute, 252, pp. 135-147.
- Site Description
- Site(s) type(s): Temperate forest
- Geography
- latitude, longitude: 39, 140
- Site(s) history: plant grown in plantation managed
- Experimental or sampling design
- Design characteristics: Six sample trees each were selected near two plots (1-A-II: low density of 1421 trees/ha, 1-B-II: high density of 2870 trees/ha) to represent each diameter class in September 1967 (Kato and Segawa 1973). Sample trees were then treated with the stratified clip technique by cutting them into parts contained in horizontal layers of 1 m depth. Fresh weights of stem, branches, and leaves were measured. Roots of four trees were excavated, separated into main, large (diameter >= 7 mm), medium (2-7 mm), fine (< 2 mm) roots, and weighted.
- Variables included: age, a.lf, a.stbh, h.t, h.c, d.bh, h.bh, c.d, m.lf, m.st, m.so, m.br, m.rt, m.to
- Species sampled: Alnus inokumae
- Research methods
- Leaf area: Leaf area was estimated from subsamples (Kato and Segawa 1973).
- Height: Method not reported in Kato and Segawa (1973).
- Biomass: Subsamples of each organ were taken from each layer and oven-dried at 80 degrees C for more tahn 48 hours (Kato and Segawa 1973). The dry-to-fresh weight ratios of these subsamples were used to calculate total dry weight of each tree component.
- Other variables: M.I. Ishihara, H. Utsugi, H. Tanouchi, and T. Hiura conducted formal search of reference databases and digitized raw data from Kato and Segawa (1973). Based on this reference, meta data was also created by M.I. Ishihara. Species name and family names were converted by M.I. Ishihara according to the following references: Satake Y, Hara H (1989a) Wild flower of Japan Woody plants I (in Japanese). Heibonsha, Tokyo; Satake Y, Hara H (1989b) Wild flower of Japan Woody plants II (in Japanese). Heibonsha, Tokyo.
- Study contacts: Masae I. Ishihara, Hajime Utsugi, Hiroyuki Tanouchi, Tsutom Hiura
Kawahara1981
Data from: Kawahara T, Kanazawa Y and Sakurai S (1981). Biomass and net production of man-made forests in the Philippines. Journal of the Japanese Forest Society, 63, pp. 320-327.
- Site Description
- Site(s) type(s): Tropical rainforest
- Geography
- latitude, longitude: 9, 126
- Site(s) history: plant grown in plantation managed, field wild
- Experimental or sampling design
- Design characteristics: In February 1980, seven or five trees from each of nine plots were felled (A2 and A4: Albizia falcata plantation, G3: Gmelina arborea plantation, S: Swietenia macrophylla plantation, D: natural Dipterocarp forest). In A4, six sample trees other than Albizia falcata were felled as well. After recording diameters at 0.3 m and 1.3m above the ground, total heights, and the height of the lowest living branch of each sample tree, the fresh weights of the stems, branches, and leaves were determined separately by the stratified-clip technique on one meter of stratum located away from the top and base.
- Variables included: a.stbh, h.t, d.bh, h.bh, m.lf, m.st, m.so, m.br
- Species sampled: Albizia falcata, Dipterocarp sp., Gmelina arborea, Swietenia macrophylla, Unknown
- Research methods
- Height: Measured by measuring tape.
- Biomass: Small samples of the respective tree components in each stand also were brought to the University of the Philippines at Los Banos for determination of oven-dry weight and leaf area. (Kawahara et al. 1981). Measured fresh weight was converted to dry weight from the ratio of dry to fresh weights.
- Other variables: M.I. Ishihara, H. Utsugi, H. Tanouchi, and T. Hiura conducted formal search of reference databases and digitized raw data from Kawahara et al. (1981). Based on this reference, meta data was also created by M.I. Ishihara. Species name and family names were converted by M.I. Ishihara according to the following references: Satake Y, Hara H (1989a) Wild flower of Japan Woody plants I (in Japanese). Heibonsha, Tokyo; Satake Y, Hara H (1989b) Wild flower of Japan Woody plants II (in Japanese). Heibonsha, Tokyo.
- Study contacts: Masae I. Ishihara, Hajime Utsugi, Hiroyuki Tanouchi, Tsutom Hiura
Kawanabe1977
Data from: Kawanabe S (1977). JIBP synthesis. In volume 16, chapter A subtropical broad-leaved forest at Yona, Okinawa. Primary productivity of Japanese forests. Productivity of terrestrial communities, pp. 268-279. University of Tokyo Press.
- Site Description
- Site(s) type(s): Temperate forest
- Geography
- latitude, longitude: 26.75, 128.22
- Site(s) history: plant grown in field wild
- Experimental or sampling design
- Design characteristics: The study site was 20 m times 20 m plot situated at ca. 320 m a. s. l. in a subtropical evergreen broadleaf forest. Stand density was 2900 trees/ha. Thriteen sample trees were chosen from the plot taking tree species and DBH distribution into consideration, and felled for destructive sampling.
- Variables included: age, a.lf, a.stbh, a.stbc, h.t, h.c, d.bh, h.bh, c.d, m.lf, m.st, m.so, m.br
- Species sampled: Camellia lutchuensis, Castanopsis sieboldii, Distylium racemosum, Machilus thunbergii, Meliosma rigida, Schefflera octophylla, Tutcheria virgata
- Research methods
- Leaf area: Method not reported.
- Stem cross sectional area: Estimated from stem diameter.
- Height: Method not reported.
- Biomass: Method not reported.
- Other variables: M.I. Ishihara, H. Utsugi, H. Tanouchi, and T. Hiura conducted formal search of reference databases and digitized raw data from Kawanabe (1977). Based on this reference, meta data was also created by M. Ishihara. Species name and family names were converted by M. Ishihara according to the following references: Satake Y, Hara H (1989a) Wild flower of Japan Woody plants I (in Japanese). Heibonsha, Tokyo; Satake Y, Hara H (1989b) Wild flower of Japan Woody plants II (in Japanese). Heibonsha, Tokyo.
- Study contacts: Masae I. Ishihara, Hajime Utsugi, Hiroyuki Tanouchi, Tsutom Hiura
Kelly0000a
Data from: Kelly J (Unpublished).
- Site Description
- Site(s) type(s):
- Geography
- latitude, longitude: -33, 151
- Site(s) history: plant grown in glasshouse
- Experimental or sampling design
- Design characteristics: Seedlings of two Eucalyptus species (Eucalytpus pilularis and Eucalyptus populnea) were grown under a treatment combination of ambient or elevated CO2 (380 or 700 ppm) and high or low water availability. Measurements listed in file represent all digitized seedlings at ~8 months for E. pilularis and ~10.5 months for E. populnea.
- Variables included: a.lf, a.cp, a.cs, h.t, d.cr, a.ilf
- Species sampled: Eucalyptus pilularis, Eucalytpus populnea
- Research methods
- Leaf area: All leaves were digitized and leaf area was calculated as the sum of all individual leaves.
- Height: Height was measured as the vertical distance from the pot surface (stem base) to the highest apex.
- Crown area: Crown surface area was estimated from digitized points, assuming the crown was a convex hull.
- Year collected: 2009
- Study contacts: Jeff W. G. Kelly
Kelly0000b
Data from: Kelly J (Unpublished).
- Site Description
- Site(s) type(s):
- Geography
- latitude, longitude: -33, 151
- Site(s) history: plant grown in glasshouse
- Experimental or sampling design
- Design characteristics: Seedlings of two Eucalyptus species (Eucalytpus pilularis and Eucalyptus populnea) were grown under a treatment combination of ambient or elevated CO2 (380 or 700 ppm) and high or low water availability. Measurements listed in file represent data from all seedlings at final harvest (~10 months for E. pilularis and ~12.5 months for E. populnea).
- Variables included: a.lf, a.stba, a.cp, h.t, d.ba, d.cr, m.lf, m.st, m.so, m.rf, m.rc, m.rt, m.to
- Species sampled: Eucalyptus pilularis, Eucalytpus populnea
- Research methods
- Leaf area: All leaves were measured in a leaf area meter (LI-COR 3100, LI-COR, Inc., Lincoln, Nebr.).
- Height: Height was measured as the vertical distance from the pot surface to the highest apex.
- Biomass: Stems, leaves and roots were destructively harvested at end of experiment (~10 months after planting for Eucalyptus pilularis and ~12.5 months for Eucalyptus populnea), and dried for 1 week at 70degreesC.
- Year collected: 2009
- Study contacts: Jeff W. G. Kelly
Kenzo2009
Data from: Kenzo T, Ichie T, Hattori D, Itioka T, Handa C, Ohkubo T, Kendawang JJ, Nakamura M, Sakaguchi M, Takahashi N, Okamoto M, Tanaka-Oda A, Sakurai K and Ninomiya I (2009). Development of allometric relationships for accurate estimation of above- and below-ground biomass in tropical secondary forests in Sarawak, Malaysia. Journal of Tropical Ecology, 25(04), pp. 371-386. DOI: 10.1017/S0266467409006129.
- Site Description
- Site(s) type(s): Tropical rainforest
- Geography
- latitude, longitude: 3.65, 113.7; 4.233333, 114.0667
- Site(s) history: plant grown in field wild
- Experimental or sampling design
- Design characteristics: All trees were harvested to measure all plant parts variables.
- Variables included: status, light, a.lf, a.stba, a.stbh, h.t, h.c, d.ba, d.bh, h.bh, c.d, m.lf, m.st, m.so, m.rf, m.rc, m.rt, m.to, ma.ilf, r.st, n.lf, n.ss, n.rf, n.rc
- Species sampled: Alstonia sp., Artocarpus elasticus, Artocarpus sp., Callicarpa havilandii, Dillenia suffruticosa, Endospermum diadenum, Fagraea racemosa, Ficus sp 1., Ficus sp 2, Ficus stolonifera, Glochidion sp., Homalanthus populneus, Macaranga bancana, Macaranga beccariana, Macaranga gigantea, Macaranga hosei, Macaranga hypoleuca, Macaranga pseudopruinosa, Macaranga trachyphylla, Macaranga winkleri, Mallotus sp., Melastoma malabathricum, Tarenna sp.
- Research methods
- Stem cross sectional area: The area was calculated from stem diameter including bark
- Height: Tree height was defined as the length from ground to the apex of the tallest shoot.
- Biomass: Total fresh weight was measured in the field and representative subsamples were dried at 60degC for at least 72h to determine dry biomass.
- Traits: Species traits were defined from flora record and our observations.
- Year collected: 2004, 2008
- Study contacts: Tanaka Kenzo, Tomoaki Ichie
Kenzo2009b
Data from: Kenzo T, Furutani R, Hattori D, Kendawang J, Tanaka S, Sakurai K and Ninomiya I (2009). Allometric equations for accurate estimation of above-ground biomass in logged-over tropical rainforests in Sarawak, Malaysia. Journal of Forest Research, 14(6), pp. 365-372. DOI: 10.1007/s10310-009-0149-1.
- Site Description
- Site(s) type(s): Tropical rainforest
- Geography
- latitude, longitude: 1.05, 110.9167; 0.9166667, 110.7167; 3.65, 113.7
- Site(s) history: plant grown in field wild
- Experimental or sampling design
- Design characteristics: All trees were harvested to measure all plant parts variables.
- Variables included: status, a.lf, a.stba, a.stbh, h.t, h.c, d.ba, d.bh, h.bh, c.d, m.lf, m.st, m.so, m.br, m.rt, m.to, ma.ilf, r.st
- Species sampled: Adina sp., Adinandra dumosa, Aglaia affinis, Aglaia bernardoi, Alphonsea johorensis, Arytera littoralis, Dryobalanops beccarii, Endocomia rufirachis, Endospermum cf. diadenum, Ficus sp., Garcinia penangiana, Kokoona ovatolanceolata, Litsea castanea, Litsea cauliflora, Macaranga costulata, Macaranga trachyphylla, Santiria apiculata, Shorea andulensis, Shorea cf. stenoptera, Shorea ovata, Shorea parvifolia, Trema sp., Unknown, Unknown sp. 1, Unknown sp. 2, Walsura pinnata, Xanthophyllum stipitatum, Xylocarpus sp.
- Research methods
- Stem cross sectional area: The area was calculated from stem diameter including bark
- Height: Tree height was defined as the length from ground to the apex of the tallest shoot.
- Biomass: Total fresh weight was measured in the field and representative subsamples were dried at 80degC for at least 72h to determine dry biomass.
- Traits: Species traits were defined from flora record and our observations.
- Year collected: 2001-2003
- Study contacts: Tanaka Kenzo
King1994
Data from: King DA (1994). Influence of light level on the growth and morphology of saplings in a Panamanian forest. American Journal of Botany, 81(8), pp. 948-957. LINK.
- Site Description
- Site(s) type(s): Tropical rainforest
- Geography
- latitude, longitude: 9.15, -79.85
- Site(s) history: plant grown in field wild
- Experimental or sampling design
- Design characteristics:
- Variables included: light, a.lf, h.t, h.bh, m.lf, m.st, m.so, a.ilf
- Species sampled: Alseis blackiana, Calophyllum longifolium, Cecropia insignis, Herrania purpurea, Miconia argentea, Palicourea guianensis, Protium panamense, Tachigali versicolor, Trichilia tuberculata
- Research methods
- Leaf area: Leaf bade length x width (spanning pinnae of compound leaves) multiplied by species specific conversion factors (near to 2/3 for most simple leaved species). 1.42 cm diameter discs punched from mature leaves (avoiding major veins) were used for determination of leaf mass per area.
- Stem cross sectional area: Measured at 4 or 5 non-standardized regularly spaced heights at smooth sections of the stem. Caliper-measured diameters in two perpendicular directions x pi/4 yields the areas, which were used only to calculate stem volumes.
- Height: Height from stem base to highest stem tip, usually that of the central stem.
- Crown area: Width in two perpendicular directions x pi/4
- Biomass: Estimated from plant part dimensional measurements to get volume (stem, and branches if present), or leaf area, which were in turn multiplied by species-specific measurements of stem density or leaf mass per unt area, respectively.
- Year collected: 1990-1991
- Study contacts: David King
King1996
Data from: King DA (1996). Allometry and life history of tropical trees. Journal of Tropical Ecology, 12, pp. 25-44. DOI: 10.1017/S0266467400009299.
- Site Description
- Site(s) type(s): Tropical rainforest
- Geography
- latitude, longitude: 10.4321, -84.003
- Site(s) history: plant grown in field wild
- Experimental or sampling design
- Design characteristics:
- Variables included: a.stba, a.cp, h.t, h.c, d.ba, h.bh, d.cr, c.d
- Species sampled: Anaxagorea crassipetala, Casearia arborea, Dipteryx panamensis, Goethalsia meiantha, Laetia procera, Lecythis ampla, Ocotea attirhensis, Ocotea dendrodaphne, Ocotea hartshorniana, Ocotea meziana, Pentaclethra macroloba, Pouroma bicolor, Rinorea deflexiflora, Virola sebifera
- Research methods
- Stem cross sectional area: Diameters of all trees <8 cm were measured in two perpendicular directions using calipers and averaged. Diameters of larger trees were calculated from their circumferences. X pi/4 yields the cross section areas. Diameters were measured at 1/10th of tree height, except for large buttressed trees for which diameter was measured above the buttress.
- Height: Height from stem base to the centre of the highest leaf and from stem base to the lowest leaf.
- Crown area: Width in two perpendicular directions x pi/4.
- Year collected: 1988-1990
- Study contacts: David King
Kitazawa1959
Data from: Kitazawa Y, Kimura M, Tezuka Y, Kurasawa H, Sakamoto M and Yishino M (1959). Plant ecology of the southern part of Osumi Peninsula. Miscellaneous reports of the Research Institute for Natural Resources, 49, pp. 19-36.
- Site Description
- Site(s) type(s):
- Geography
- latitude, longitude: 31.2, 130.9
- Site(s) history: plant grown in field wild
- Experimental or sampling design
- Design characteristics: The survey was conducted in a Distylium racemosum dominated primary evergreen broadleaved forest (aspect: south, slope: ca. 10 degrees) at Mt. Arase, Osumi Peninsula, Kyushu, Japan during October 19th to 29th, 1958 (Kitazawa et al. 1959). Nine trees of various sizes were cut at ground level.
- Variables included: a.lf, a.stbh, h.t, d.bh, m.lf, m.so
- Species sampled: Camellia japonica, Cinnamomum japonicum, Cleyera japonica, Daphniphyllum macropodum, Distylium racemosum, Illicium anisatum, Machilus japonica, Quercus salicina
- Research methods
- Leaf area: Leaf area of a tree was estimated from dry mass of leaves and the ratio of leaf area to dry mass. Dry mass was estimated from fresh mass of leaves.
- Height: Method not reported.
- Biomass: Fresh mass of leaves and woody parts (branches and stem) were measured at the field. Fresh mass of woody parts were only measured for six trees. They were converted to dry mass from the fresh to dry mass ratio. The ratio was estimated from subsamples.
- Other variables: M.I. Ishihara, H. Utsugi, H. Tanouchi, and T. Hiura conducted formal search of reference databases and digitized raw data from Kitazawa et al. (1959). Based on this reference, meta data was also created by M.I. Ishihara. Species name and family names were converted by M.I. Ishihara according to the following references: Satake Y, Hara H (1989a) Wild flower of Japan Woody plants I (in Japanese). Heibonsha, Tokyo; Satake Y, Hara H (1989b) Wild flower of Japan Woody plants II (in Japanese). Heibonsha, Tokyo.
- Study contacts: Masae I. Ishihara, Hajime Utsugi, Hiroyuki Tanouchi, Tsutom Hiura
Kohyama0000
Data from: Kohyama T and Grubb PJ (Unpublished).
- Site Description
- Site(s) type(s): Temperate rainforest
- Geography
- latitude, longitude: 30.34678, 130.5164
- Site(s) history: plant grown in field wild
- Experimental or sampling design
- Design characteristics: Abundant/representing species with high sapling(seedling) density under closed canopy were selected, based on the permanent plot censuses in primary forest. Chosen individuals were apparently seed origin and without obvious sign of past stem breakage.
- Variables included: status, a.cp, h.t, d.cr, m.lf, m.st, m.so, m.rt, m.to
- Species sampled: Ardisia crenata, Cinnamomum japonicum, Daphne kiusiana, Sarcandra glabra, Syzygium buxifolium
- Research methods
- Leaf area: Leaf and root images were scanned with a photo-copy machine. Leaf images were cut, weighed, and converted to area from unit-area weight of used paper.
- Stem cross sectional area: Two perpendicular diameters were measured for the main stem at 1/10 of top height using a calliper, and cross-section area was obtained as that of ellipsoid with two diameters.
- Height: the vertical distance from the base on soil surface to the highest leaf, measured by a pole or a convex steal measure tape.
- Crown area: Two horizontal widths of crowns were obtained with a convex steel measure tape. The maximum width was obtained first, and the other was the maximum one along the perpendicular angle to the first one. Crown projection area was calculated from these two widths as an ellipsoid area.
- Biomass: Entire samples were put into electric oven at 80C over a couple of days to yield oven-dry weight, measured with an electric balance.
- Other variables: Root widths were obtained similarly to crown widths. Crown depth was estimated from excavated whole roots with natural 3D reconstruction in the field. Total fine root length was traced from a photocopied image of the root system, using a digital distance meter.
- Year collected: 1990
- Study contacts: Takashi Kohyama
Kohyama1987
Data from: Kohyama T (1987). Significance of architecture and allometry in saplings. Functional Ecology, 1(4), pp. 399-404. DOI: 10.2307/2389797.
- Site Description
- Site(s) type(s): Temperate rainforest
- Geography
- latitude, longitude: 30.31667, 130.4333
- Site(s) history: plant grown in field wild
- Experimental or sampling design
- Design characteristics: Abundant/representing species with high sapling(seedling) density under closed canopy were selected, based on the permanent plot censuses in primary forest. Chosen individuals were apparently seed origin and without obvious sign of past stem breakage.
- Variables included: status, a.lf, a.stbh, a.cp, h.t, h.c, d.bh, h.bh, d.cr, c.d, m.lf, m.st, m.so, m.br
- Species sampled: Camellia sasanqua, Cleyera japonica, Distylium racemosum, Eurya japonica, Litsea acuminata, Myrsine seguinii, Neolitsea aciculata, Symplocos glauca, Symplocos purnifolia
- Research methods
- Leaf area: The outline of the entire leaf(let)-brade (excluding petiole/rachis) was traced by thin tracing paper. The traced leaf brades were cut, weighed, and converted to area from unit-area weight of used paper.
- Stem cross sectional area: Two perpendicular diameters were measured for the main stem at 1/10 of top height using a calliper, and cross-section area was obtained as that of ellipsoid with two diameters.
- Height: the vertical distance from the base on soil surface to the highest leaf, measured by a pole or a convex steal measure tape.
- Crown area: Two horizontal widths of crowns were obtained with a convex steel measure tape. The maximum width was obtained first, and the other was the maximum one along the perpendicular angle to the first one. Crown projection area was calculated from these two widths as an ellipsoid area.
- Biomass: Entire samples were put into electric oven at 80degC over a couple of days to yield oven-dry weight, measured with an electric balance.
- Year collected: 1983
- Study contacts: Takashi Kohyama
Kohyama1990
Data from: Kohyama T and Hotta M (1990). Significance of allometry in tropical saplings. Functional Ecology, 4(4), pp. 515-521. DOI: 10.2307/2389319.
- Site Description
- Site(s) type(s): Tropical rainforest
- Geography
- latitude, longitude: -0.9166667, 100.5
- Site(s) history: plant grown in field wild
- Experimental or sampling design
- Design characteristics: Abundant/representing species with high sapling(seedling) density under closed canopy were selected, based on the permanent plot censuses in primary forest. Chosen individuals were apparently seed origin and without obvious sign of past stem breakage.
- Variables included: status, a.lf, a.stbh, a.cp, h.t, h.c, d.bh, h.bh, d.cr, c.d, m.lf, m.st, m.so, m.br, ma.ilf
- Species sampled: Cleistanthus glandulosus, Diospyrus sumatrana, Gonystylus forbesii, Grewia florida, Hopea dryobalanoides, Mastixia trichotoma, Nephelium juglandifolium, Shorea sumatrana, Swintonia schwenkii
- Research methods
- Leaf area: The outline of the entire leaf(let)-brade (excluding petiole/rachis) was traced by thin tracing paper. The traced leaf brades were cut, weighed, and converted to area from unit-area weight of used paper.
- Stem cross sectional area: Two perpendicular diameters were measured for the main stem at 1/10 of top height using a calliper, and cross-section area was obtained as that of ellipsoid with two diameters.
- Height: the vertical distance from the base on soil surface to the highest leaf, measured by a pole or a convex steal measure tape.
- Crown area: Two horizontal widths of crowns were obtained with a convex steel measure tape. The maximum width was obtained first, and the other was the maximum one along the perpendicular angle to the first one. Crown projection area was calculated from these two widths as an ellipsoid area.
- Biomass: Entire samples were put into electric oven at 80degC over a couple of days to yield oven-dry weight, measured with an electric balance.
- Year collected: 1984, 1987
- Study contacts: Takashi Kohyama
Kohyama1994
Data from: Kohyama T and Grubb PJ (1994). Below-and above-ground allometries of shade-tolerant seedlings in a Japanese warm-temperate rain forest. Functional Ecology, 8(2), pp. 229-236. LINK.
- Site Description
- Site(s) type(s): Temperate rainforest
- Geography
- latitude, longitude: 30.34678, 130.5164
- Site(s) history: plant grown in field wild
- Experimental or sampling design
- Design characteristics: Abundant/representing species with high sapling(seedling) density under closed canopy were selected, based on the permanent plot censuses in primary forest. Chosen individuals were apparently seed origin and without obvious sign of past stem breakage.
- Variables included: status, a.lf, a.cp, h.t, d.cr, m.lf, m.st, m.so, m.rt, m.to, ma.ilf
- Species sampled: Camellia japonia, Camellia sasanqua, Cleyera japonica, Distylium racemosum, Eurya japonica, Illicium anisatsum, Litsea acuminata, Myrsine seguinii, Neolitsea aciculata, Podocarpus nagi, Rhododendron tashiroi, Symplocos glauca, Symplocos purnifolia, Symplocos tanakae
- Research methods
- Leaf area: Leaf and root images were scanned with a photo-copy machine. Leaf images were used to determine leaf area using an area meter (Delta-T Devices, Cambrige, UK). The photo-copy machine cause a 0.19% by 0.28% reduction in length and 0.47% in area.
- Stem cross sectional area: Two perpendicular diameters were measured for the main stem at 1/10 of top height using a calliper, and cross-section area was obtained as that of ellipsoid with two diameters.
- Height: the vertical distance from the base on soil surface to the highest leaf, measured by a pole or a convex steal measure tape.
- Crown area: Two horizontal widths of crowns were obtained with a convex steel measure tape. The maximum width was obtained first, and the other was the maximum one along the perpendicular angle to the first one. Crown projection area was calculated from these two widths as an ellipsoid area.
- Biomass: Entire samples were put into electric oven at 80degC over a couple of days to yield oven-dry weight, measured with an electric balance.
- Other variables: Root widths were obtained similarly to crown widths. Crown depth was estimated from excavated whole roots with natural 3D reconstruction in the field. Total fine root length was traced from a photocopied image of the root system, using a digital distance meter.
- Year collected: 1990
- Study contacts: Takashi Kohyama
Komiyama2002
Data from: Komiyama A, Kato S and Ninomiya I (2002). Allometric relationships for deciduous broad-leaved forests in Hida district, Gifu Prefecture, Japan. Journal of the Japanese Forestry Society, 84, pp. 130-134.
- Site Description
- Site(s) type(s): Temperate forest
- Geography
- latitude, longitude: 36.08, 137; 35.98, 137.2
- Site(s) history: plant grown in field wild
- Experimental or sampling design
- Design characteristics: Sample trees were felled in a Quercus crispula mixed forest (Shoukawa village,1000 m a.s.l., ca. 100 years old) in July 1990 and 1991 and in a Betula maximowicziana mixed forest (950 m a.s.l., ca. 60 years old) and in a Fagus japonica forest (1050 m a.s.l., ca. 60 years old) in Gifu University Kuraiyama Forest in July 1992 and 1993 (Komiyama et al. 2002). After felling, tree height, height of the lowest living branch, stem diameters at 0, 0.3, 1.3, 2.3 m and at interval of 1 m upward, stem diameter of the lowest living branch were measured. Fresh weights of stem, branches, and leaves were measured.
- Variables included: a.lf, a.stbh, a.stbc, h.t, h.c, d.bh, h.bh, c.d, m.lf, m.st, m.so, m.br
- Species sampled: Acer amoenum, Acer mono, Acer sieboldianum, Aesculus turbinata, Betula grossa, Betula maximowicziana, Betula platyphylla, Carpinus japonica, Castanea crenata, Fagus japonica, Magnolia obovata, Prunus grayana, Quercus crispula, Quercus serrata, Sorbus alnifolia, Swida controversa, Tilia japonica
- Research methods
- Leaf area: Subsample of leaves were collected from each layer and individual leaf area was measured by a leaf area meter. Total leaf area was estimated as the sum of leaf areas of each layer, which are estimated from the leaf mass of the layer and SLA of subsampled leaves (A. Komiyama, personal communication).
- Stem cross sectional area: Stem diameter at the lowest branch was measured.
- Height: Measured after trees were felled (Komiyama et al. 2002).
- Biomass: Subsamples (ca. 400 g) of each organ for each species were oven-dried at 110 degrees C for more than 48 hours. The dry-to-fresh mass ratios of these subsamples were used to calculate total dry mass of each tree component.
- Other variables: Species name and family names were converted by M.I. Ishihara according to the following references: Satake Y, Hara H (1989a) Wild flower of Japan Woody plants I (in Japanese). Heibonsha, Tokyo; Satake Y, Hara H (1989b) Wild flower of Japan Woody plants II (in Japanese). Heibonsha, Tokyo.
- Study contacts: Akira Komiyama
Komiyama2003
Data from: Komiyama A, Ohne M and Kato S (2003). Comparison of vertical distribution of root weight between Hinoki cypress (Camaecyparis obtusa) and oak (Quercus crispula) individuals growing in a Hinoki plantation. Journal of the Japanese Forest Society, 85, pp. 152-155.
- Site Description
- Site(s) type(s): Temperate forest
- Geography
- latitude, longitude: 36, 137.2
- Site(s) history: plant grown in field wild, plantation managed
- Experimental or sampling design
- Design characteristics: The sampled Quercus crispula tree was naturally regenerated in a Chamaecyparis obtusa plantation (1040 m a.s.l., 48 years old, slope 20-23 degrees, density 1412 trees/ha, basal area 42.2 square m) and felled on 29 May to 5 June 2000 (Komiyama et al. 2003). The Chamaecyparis obtusa tree was sampled from this stand on 17-31 May 2001. Before felling, stem diameters at 0, 0.3, and 1.3 m height were measured. After felling, tree height and height and stem diameter at the lowest living branch were measured.
- Variables included: age, a.stba, a.stbh, a.stbc, h.t, h.c, d.ba, d.bh, h.bh, c.d, m.so
- Species sampled: Chamaecyparis obtusa, Quercus crispula
- Research methods
- Stem cross sectional area: Estimated from stem diameter.
- Height: Measured after trees were felled (Komiyama et al. 2003).
- Biomass: Fresh weights of stem, branches, and leaves were measured. Subsamples (ca. 500 g) of each aboveground organ were oven-dried at 110 degrees C (Komiyama et al. 2003; personal communication). The dry-to-fresh mass ratios of these subsamples were used to calculate total dry mass of each tree aboveground component. Because root biomass was estimated from root density of soil samples, M.I. Ishihara excluded root biomass from this data set.
- Other variables: Species name and family names were converted by M.I. Ishihara according to the following references: Satake Y, Hara H (1989a) Wild flower of Japan Woody plants I (in Japanese). Heibonsha, Tokyo; Satake Y, Hara H (1989b) Wild flower of Japan Woody plants II (in Japanese). Heibonsha, Tokyo.
- Study contacts: Akira Komiyama
leMaire2011
Data from: le Maire G, Marsden C, Verhoef W, Ponzoni FJ, Lo Seen D, Bégué A, Stape J and Nouvellon Y (2011). Leaf area index estimation with MODIS reflectance time series and model inversion during full rotations of Eucalyptus plantations. Remote Sensing of Environment, 115(2), pp. 586-599. DOI: 10.1016/j.rse.2010.10.004.
- Site Description
- Site(s) type(s): Tropical seasonal forest
- Geography
- latitude, longitude: -22.353, -46.96551; -22.12377, -47.0772; -22.2042, -48.14363; -22.22862, -48.14585; -22.20017, -48.0512; -22.21696, -48.13749; -22.25313, -48.09957
- Site(s) history: plant grown in plantation managed
- Experimental or sampling design
- Design characteristics: Six to ten trees were sampled for each stand at each date. Before each sampling campaign height and DBH were measured on three permanent plots. The diameter distribution was divided into 6-10 classes, and one tree per class was randomly selected outside the permanent plots.
- Variables included: lai, status, light, age, a.lf, a.ssba, a.stbh, a.cp, h.t, h.c, d.bh, h.bh, d.cr, c.d, m.lf, m.br, ma.ilf, r.st
- Species sampled: Eucalyptus urophylla Eucalyptus grandis (clone)*
- Research methods
- Leaf area: Destructive measurements: All leaves of each of three crown sections (lower, middle and upper) were removed, and weighed. Twenty-five leaves were randomly selected in each section, and their fresh mass and area were immediately measured. These leaves were then dried at 65.8C to constant weight, and their dry weights were used in conjunction with their measured area to calculate specific leaf area for each crown section. The foliage dry weight of each crown section was calculated from the foliage fresh weight and the dry to fresh weight ratio of the sub-samples. The leaf area of each crown section was calculated as the product of foliage dry weight and specific leaf area. Tree leaf area was obtained by summing the leaf area of the three crown sections.
- Stem cross sectional area: Stem cross sectional area of each tree was calculated from circumference at breast height measurement.
- Height: Sampled trees were felled and measured for total height and height to crown base.
- Biomass: Only the living branches and leaves mass was measured. Fresh mass of each component was measured on the field. Component biomass was sub-sampled to evaluate the dry matter content: about 25% of branch compartment and 25 leaves by level within the crown (bottom, middle, top). Aliquots were weighed before and after drying at 65degC to constant weight. The dry weight of each component was calculated from measured fresh weight and the dry to fresh weight ratio of the sub-samples.
- Traits: Wood density was measured with trunk disks, approximately 3 cm thickness (with bark), cut at 0.1 and 1.3 m (breast height), as well as at 25%, 50%, 75% and 100% of tree height up to the base of the crown. Basic density was determined for each disk using the maximum moisture content method. Sapwood area were visually delimited on thin trunk disks at tree base.
- Other variables: Age of trees were calculated from planting date obtained from the management company. The numbering of the tree is related to the tree light environments - see le Maire et al. 2011 [doi:10.1016/j.rse.2010.10.004] and Marsden et al. 2010 [doi:10.1016/j.foreco.2009.07.039].
- Year collected: 2008
- Study contacts: Guerric le Maire
Lewis2013
Data from: Lewis JD, Smith RA, Ghannoum O, Logan BA, Phillips NG and Tissue DT (2013). Industrial-age changes in atmospheric [CO2] and temperature differentially alter responses of faster- and slower-growing Eucalyptus seedlings to short-term drought. Tree Physiology, 33(5), pp. 475-488. DOI: 10.1093/treephys/tpt032.
- Site Description
- Site(s) type(s):
- Geography
- latitude, longitude: -33.61, 150.75
- Site(s) history: plant grown in glasshouse
- Experimental or sampling design
- Design characteristics: Two Eucalyptus species (Eucalyptus saligna and Eucalyptus sideroxylon) were grown at full field capacity under a treatment combination of ambient or elevated temperature (26/18C or 30/22C) and subambient, ambient or elevated CO2 (280, 400 or 640 ?L L-1). Near the end of the experiment, one half of the seedlings were subjected to a short term drought. All Seedlings were grown for from 78 to 85 days from planting, at which time they were subjected to a destructive harvest of all biomass.
- Variables included: a.lf, m.lf, m.st, m.so, m.rt, m.to, ma.ilf
- Species sampled: Eucalyptus saligna, Eucalyptus sideroxylon
- Research methods
- Leaf area: All leaves were measured in a leaf area meter (LI-COR 3100, LI-COR, Inc., Lincoln, Nebr.).
- Height: Height was measured as the vertical distance from the pot surface to the highest apex.
- Biomass: Stems, leaves and roots were destructively harvested on multiple days (78, 79, 80, 83 and 85 days) after planting, and dried for 1 week at 70degreesC.
- Year collected: 2011
- Study contacts: David Tissue
Lusk0000a
Data from: Lusk CH (Unpublished).
- Site Description
- Site(s) type(s): Temperate rainforest
- Geography
- latitude, longitude: -37.25, 175.3
- Site(s) history: plant grown in field wild
- Experimental or sampling design
- Design characteristics: We obtained 200 - 350 mm tall seedlings from Miranda Scenic Reserve (NZ) from second-growth stands and margins of warm-temperate rainforest. Crown architecture of each seedling was recorded using a using a FASTRAK 3D-digitizer (Polhemus, Colchester, VT, USA), in conjunction with the software package FLORADIG (CSIRO Entomology, Brisbane, Australia).
- Variables included: a.lf, a.stba, a.cp, a.cs, h.t, h.c, d.ba, d.cr, c.d, m.lf, m.st, m.so, m.rt, m.to, a.ilf
- Species sampled: Kunzea ericoides
- Research methods
- Leaf area: The total foliage area of each plant was measured using a LI-3100 leaf Area Meter
- Stem cross sectional area: Basal stem diameter (immediately above any root flanges) was measured on two orthogonal axis, using electronic callipers.
- Height: Height was measured as the length of the longest stem, from the ground to the apex.
- Crown area: Crown area was computed from the plant architecture data obtained using the 3D digitizer.
- Biomass: Plants were divided into stem, leaf and root fractions and then dried to a constant weight. Petioles of simple leaves were included in total leaf mass.
- Year collected: 2006
- Study contacts: Christopher H. Lusk
Lusk0000b
Data from: Lusk CH (Unpublished).
- Site Description
- Site(s) type(s):
- Geography
- latitude, longitude: -37.7869, 175.3139
- Site(s) history: plant grown in glasshouse
- Experimental or sampling design
- Design characteristics: We obtained 200 - 350 mm tall seedlings from commercial sources and grew them in a glasshouse for 105 days. Crown architecture of each seedling was recorded using a using a FASTRAK 3D-digitizer (Polhemus, Colchester, VT, USA), in conjunction with the software package FLORADIG (CSIRO Entomology, Brisbane, Australia).
- Variables included: a.lf, h.t, m.lf, m.st, m.so, m.rt, m.to
- Species sampled: Pseudopanax arboreus, Pseudopanax crassifolius, Schefflera digitata
- Research methods
- Leaf area: The total foliage area of each plant was measured using a LI-3100 leaf Area Meter
- Stem cross sectional area: Basal stem diameter (immediately above any root flanges) was measured on two orthogonal axis, using electronic callipers.
- Height: Height was measured as the length of the longest stem, from the ground to the apex.
- Crown area: Crown area was computed from the plant architecture data obtained using the 3D digitizer.
- Biomass: Plants were divided into stem, leaf and root fractions and then dried to a constant weight. Petioles of simple leaves were included in total leaf mass. Petioles of compound leaves were included in the stem fraction.
- Other variables: Relative growth rates of stem height and volume were measured. Transverse sections were taken from base of each stem to measure vessel diameters and densities. Theoretical sapwood conductivity was then computed from the xylem anatomy data. Actual measurements of sapwood conductivity were also carried out.
- Year collected: 2012
- Study contacts: Christopher H. Lusk
Lusk2002
Data from: Lusk CH (2002). Leaf area accumulation helps juvenile evergreen trees tolerate shade in a temperate rainforest. Oecologia, 132(2), pp. 188-196. DOI: 10.1007/s00442-002-0974-9.
- Site Description
- Site(s) type(s): Temperate rainforest
- Geography
- latitude, longitude: -40.65, -72.18
- Site(s) history: plant grown in field wild
- Experimental or sampling design
- Design characteristics: This study was carried out in a 35-year-old second-growth forest fragment dominated by Nothofagus dombeyi, in Parque Nacional Puyehue, Chile (40°39S, 72°11W). 0.2-1.0m tall seedlings of the eight commonest species in the understory were sampled along a 40m wide transect running from the margin to the interior of the stand. Seedling survival was measured from June 2000 till August 2001, when gas exchange was measured and subsamples of plants were harvested for calculation of growth and biomass distribution parameters.
- Variables included: a.lf, h.t, m.lf, m.st, m.so, m.rt, m.to
- Species sampled: Aextoxicon punctatum, Aristotelia chilensis, Embothrium coccineum, Eucryphia cordifolia, Gevuina avellana, Laureliopsis philippiana, Luma apiculata, Myrceugenia planipes
- Research methods
- Leaf area: The total foliage area of each sapling was measured using An ADC AM100 leaf area meter (ADC BioScientific, Hoddesdon, Hertfordshire, England).
- Stem cross sectional area: Basal stem diameter (immediately above any root flanges) was measured on two orthogonal axis, using electronic callipers.
- Height: Height was measured as the length of the longest stem, from the ground to the apex.
- Biomass: Saplings were divided into root, stem, and leaf fractions, and then dried at 70degC for 72h. Leaf petioles were included in total leaf mass.
- Other variables: The light environment of each seedling (% canopy openness) was estimated using a pair of LAI-2000 canopy analyzers (Li-COR, Lincoln, Nebr); Mean annual rainfall provided.
- Year collected: 2000-2001
- Study contacts: Christopher H. Lusk
Lusk2004
Data from: Lusk CH (2004). Leaf area and growth of juvenile temperate evergreens in low light: species of contrasting shade tolerance change rank during ontogeny. Functional Ecology, 18(6), pp. 820-828. DOI: 10.1111/j.0269-8463.2004.00897.x.
- Site Description
- Site(s) type(s): Temperate rainforest
- Geography
- latitude, longitude: -40.65, -72.18
- Site(s) history: plant grown in field wild
- Experimental or sampling design
- Design characteristics: This study was carried out in a 35-year-old second-growth forest fragment dominated by Nothofagus dombeyi, in Parque Nacional Puyehue, Chile (40deg39S, 72deg11W). Seedlings 25-1180 mm tall of four evergreens differing in shade tolerance were sampled in low light (2-5% canopy openness). Seedling growth was measured from April 2002 till March 2003, when plants were harvested for calculation of growth and biomass distribution parameters.
- Variables included: a.lf, h.t, m.lf, m.st, m.so, m.rt, m.to
- Species sampled: Aextoxicon punctatum, Aristotelia chilensis, Eucryphia cordifolia, Myrceugenia planipes
- Research methods
- Leaf area: The total foliage area of each sapling was measured using An ADC AM100 leaf area meter (ADC BioScientific, Hoddesdon, Hertfordshire, England).
- Stem cross sectional area: Basal stem diameter (immediately above any root flanges) was measured on two orthogonal axis, using electronic callipers.
- Height: Height was measured as the length of the longest stem, from the ground to the apex.
- Biomass: Saplings were divided into root, stem and leaf fractions, and then dried at 70degC for 72 h. Leaf petioles were included in total leaf mass.
- Other variables: The light environment of each seedling (% canopy openness) was estimated using a pair of LAI-2000 canopy analyzers (Li-COR, Lincoln, Nebr); Mean annual rainfall provided.
- Year collected: 2002-2003
- Study contacts: Christopher H. Lusk
Lusk2011
Data from: Lusk CH, Pérez-Millaqueo MM, Piper FI and Saldaña A (2011). Ontogeny, understorey light interception and simulated carbon gain of juvenile rainforest evergreens differing in shade tolerance. Annals of Botany, 108, pp. 419-428. DOI: 10.1093/aob/mcr166.
- Site Description
- Site(s) type(s): Temperate rainforest
- Geography
- latitude, longitude: -40.65, -72.18
- Site(s) history: plant grown in field wild
- Experimental or sampling design
- Design characteristics: This study was carried out in a 35-year-old second-growth forest fragment dominated by Nothofagus dombeyi, in Parque Nacional Puyehue, Chile (40deg39S, 72deg11W). The biomass distribution of juveniles (17-740 mm tall) of seven temperate rainforest evergreens growing in low (approx. 4 %) light in the understorey of a second-growth stand was quantified. Daytime and night-time gas exchange rates of leaves were also determined, and crown architecture was recorded using a using a FASTRAK 3D-digitizer (Polhemus, Colchester, VT, USA), in conjunction with the software package FLORADIG (CSIRO Entomology, Brisbane, Australia). YPCONVERT, developed by Daniel Falster, was used to convert architecture files to a format compatible with YPLANT.
- Variables included: a.lf, a.stba, a.cp, a.cs, h.t, h.c, d.ba, d.cr, c.d, m.lf, m.st, m.so, m.rt, m.to, a.ilf
- Species sampled: Aextoxicon punctatum, Amomyrtus luma, Aristotelia chilensis, Eucryphia cordifolia, Laureliopsis philippiana, Myrceugenia planipes, Nothofagus dombeyi
- Research methods
- Leaf area: The total foliage area of each plant was measured photographically.
- Stem cross sectional area: Basal stem diameter (immediately above any root flanges) was measured on two orthogonal axis, using electronic callipers.
- Height: Height was measured as the length of the longest stem, from the ground to the apex.
- Crown area: Crown area was computed from the plant architecture data obtained using the 3D digitizer.
- Biomass: Saplings were divided into root, stem, and leaf fractions, and then dried to a constant weight. Leaf petioles were included in total leaf mass.
- Traits: n/a.
- Other variables: Mean annual rainfall provided. Leaf lifespans of six of the seven species were estimated by monitoring leaf survival over 12 months. A Nikon Coolpix digital camera (Nikon Corporation, Japan) with a 182 degree fisheye adapter was used to take a hemispherical photograph directly above each seedling. Analysis of hemispherical photographs indicated that canopy openness above the selected seedlings ranged from 2.3% to 5.6%, including small but significant differences between species (P < 0.001). Since the aim of the present study was to compare species under standardized conditions, a composite light environment derived using canopy structure information obtained from analysing the set of 159 photographs taken above the seedlings was created (Falster and Westoby, 2003). This was equivalent to ca. 4.0% canopy openness.
- Year collected: 2006-2008
- Study contacts: Christopher H. Lusk
Lusk2012
Data from: Lusk CH, Pérez-Millaqueo MM, Saldaña A, Burns BR, Laughlin DC and Falster DS (2012). Seedlings of temperate rainforest conifer and angiosperm trees differ in leaf area display. Annals of Botany, 110, pp. 177-188. DOI: 10.1093/aob/mcs095.
- Site Description
- Site(s) type(s): Temperate rainforest
- Geography
- latitude, longitude: -40.65, -72.18; -37.25, 175.3
- Site(s) history: plant grown in field wild
- Experimental or sampling design
- Design characteristics: We sampled seedlings of common conifer and angiosperm species, at four temperate rainforest sites in Chile and one in New Zealand, chosen to represent a range of climatic and edaphic conditions. We sampled 15-21 seedlings of each species, ranging in height from 50 to 350 mm tall. Crown architecture of each seedling was recorded using a using a FASTRAK 3D-digitizer (Polhemus, Colchester, VT, USA), in conjunction with the software package FLORADIG (CSIRO Entomology, Brisbane, Australia). YPCONVERT, developed by Daniel Falster, was used to convert architecture files to a format compatible with YPLANT.
- Variables included: a.lf, a.stba, a.cp, a.cs, h.t, h.c, d.ba, d.cr, c.d, m.lf, m.st, m.so, m.rt, m.to, a.ilf
- Species sampled: Agathis australis, Amomyrtus luma, Araucaria araucana, Drimys winteri, Knightia excelsa, Lomatia hirsuta, Nothofagus dombeyi, Nothofagus nitida, Nothofagus truncata, Persea lingue, Phyllocladus trichomanoides, Podocarpus nubigena, Podocarpus salignus, Saxegothaea conspicua
- Research methods
- Leaf area: The total foliage area of each plant was measured photographically.
- Stem cross sectional area: Basal stem diameter (immediately above any root flanges) was measured on two orthogonal axis, using electronic callipers.
- Height: Height was measured as the length of the longest stem, from the ground to the apex.
- Crown area: Crown area was computed from the plant architecture data obtained using the 3D digitizer.
- Biomass: Saplings were divided into root, stem, and leaf fractions, and then dried to a constant weight. Leaf petioles were included in total leaf mass.
- Traits: Three of the 18 species are heteroblastic i.e. undergo significant ontogenetic changes in leaf morphology. Accordingly we digitized two or three different leaf shapes for each of these species (Myrceugenia, Aextoxicon, Phyllocladus) and used whichever was most appropriate for each plant.
- Other variables: Mean annual temperature and soil N, P and C data are provided. A Nikon Coolpix digital camera (Nikon Corporation, Japan) with a 182 degree fisheye adapter was used to take a hemispherical photograph directly above each seedling.
- Year collected: 2004-2009
- Study contacts: Christopher H. Lusk
Lusk2013
Data from: Lusk CH, Kaneko T, Grierson E and Clearwater M (2013). Correlates of tree species sorting along a temperature gradient in New Zealand rain forests: seedling functional traits, growth and shade tolerance. Journal of Ecology, 101(6), pp. 1531-1541. DOI: 10.1111/1365-2745.12152.
- Site Description
- Site(s) type(s):
- Geography
- latitude, longitude: -37.7869, 175.3139
- Site(s) history: plant grown in glasshouse
- Experimental or sampling design
- Design characteristics: We obtained 200 - 350 mm tall seedlings from commercial sources and grew them in a glasshouse for 105 days. Crown architecture of each seedling was recorded using a using a FASTRAK 3D-digitizer (Polhemus, Colchester, VT, USA), in conjunction with the software package FLORADIG (CSIRO Entomology, Brisbane, Australia). YPCONVERT, developed by Daniel Falster, was used to convert architecture files to a format compatible with YPLANT.
- Variables included: a.lf, a.stba, a.cp, a.cs, h.t, h.c, d.ba, d.cr, c.d, m.lf, m.st, m.so, m.rt, m.to, a.ilf
- Species sampled: Beilschmiedia tarairi, Beilschmiedia tawa, Dysoxylum spectabile, Elaeocarpus dentatus, Griselinia littoralis, Knightia excelsa, Laurelia novaezelandiae, Litsea calicaris, Melicytus ramiflorus, Metrosideros umbellata, Nestegis cunninghamii, Nothofagus menziesii, Nothofagus solandri var cliffortioides, Nothofagus truncata, Vitex lucens, Weinmannia racemosa, Weinmannia silvicola
- Research methods
- Leaf area: The total foliage area of each plant was measured using a LI-3100 leaf Area Meter
- Stem cross sectional area: Basal stem diameter (immediately above any root flanges) was measured on two orthogonal axis, using electronic callipers.
- Height: Height was measured as the length of the longest stem, from the ground to the apex.
- Crown area: Crown area was computed from the plant architecture data obtained using the 3D digitizer.
- Biomass: Only aboveground biomass was harvested. Plants were divided into stem and leaf fractions and then dried to a constant weight. Petioles of simple leaves were included in total leaf mass. Petioles of compound leaves were included in the stem fraction.
- Traits: Note that only aboveground biomass was harvested.
- Other variables: Relative growth rates of stem height and volume were measured. Transverse sections were taken from base of each stem to measure vessel diameters and densities. Theoretical sapwood conductivity was then computed from the xylem anatomy data. Actual measurements of sapwood conductivity were also carried out.
- Year collected: 2011-2012
- Study contacts: Christopher H. Lusk
Maguire1998
Data from: Maguire DA, Brissette JC and Gu L (1998). Crown structure and growth efficiency of red spruce in uneven-aged, mixed-species stands in Maine. Canadian Journal of Forest Research, 28(8), pp. 1233-1240. DOI: 10.1139/x98-093.
- Site Description
- Site(s) type(s):
- Geography
- latitude, longitude: 44.87, -68.63
- Site(s) history: plant grown in plantation managed
- Experimental or sampling design
- Design characteristics: Sample trees were selected uniformly across the diameter range (11-48cm) and in association with nested permanent plots.
- Variables included: a.lf, a.stbh, a.cp, a.cs, h.t, h.c, d.bh, h.bh, d.cr, c.d, m.lf
- Species sampled: Picea rubens
- Research methods
- Leaf area: Determined from total leaf mass and leaf mass per area on subsampled foliage (see sections below).
- Stem cross sectional area: From diameter at breast height to the nearest 0.1cm.
- Height: Total tree height to the nearest 0.1m.
- Crown area: Crown radius was measured in four cardinal directions.
- Biomass: For forty trees, a sample branch was collected. These sample branches were analyzed for dry weight, and leaf subsamples were collected for leaf area determination. For the 16 trees in this dataset, branch regressions were used to estimate total leaf mass from the 40 sample branches.
- Traits: Leaf mass per area was determined for a leaf subsample from the sample branches, sampled across the leaf age classes in approximate proportion to their representation on the whole branch. Leaf area was measured as projected area on 100 needles.
- Other variables: Sapwood area was determined on sample disks taken from all trees, by staining with methyl orange to determine sapwood/heartwood transition, and image analysis to measure the sapwood area.
- Study contacts: Douglas A. Maguire
Markesteijn2009
Data from: Markesteijn L and Poorter L (2009). Seedling root morphology and biomass allocation of 62 tropical tree species in relation to drought- and shade-tolerance. Journal of Ecology, 97(2), pp. 311-325. DOI: 10.1111/j.1365-2745.2008.01466.x.
- Site Description
- Site(s) type(s): Tropical seasonal forest
- Geography
- latitude, longitude: -16.12, -61.72
- Site(s) history: plant grown in field wild
- Experimental or sampling design
- Design characteristics: Seedlings were excavated at the onset of the dry season (April-May) to evaluate seedling morphology just before they were exposed to drought for the first time.
- Variables included: status, light, a.lf, a.stba, a.stbc, h.c, d.ba, m.lf, m.st, m.so, m.br, m.rf, m.rc, m.rt, m.to, a.ilf, ma.ilf, r.st
- Species sampled: Acosmium cardenasii, Alibertia verrucosa, Ampelocera ruizii, Anadenanthera colubrina, Aspidosperma cylindrocarpon, Aspidosperma tomentosum, Batocarpus amazonicus, Bougainvillea modesta, Caesalpinia pluviosa, Capparis prisca, Cariniana estrellensis, Cariniana ianeirensis, Casearia gossypiosperma, Cavanillesia hylogeiton, Cecropia concolor, Cedrela fissilis, Ceiba samaura, Ceiba speciosa, Centrolobium microchaete, Combretum leprosum, Copaifera chodatiana, Erythroxylum daphnites, Ficus boliviana, Gallesia integrifolia, Heliocarpus americanus, Hirtella triandra, Hura crepitans, Hymenaea courbaril, Jacaratia sp., Jacaratia spinosa, Licaria triandra, Machaerium acutifolium, Myrciaria cauliflora, Neea cf. steinbachii, Ocotea sp., Ocotea sp. 2, Phyllostylon rhamnoides, Pogonopus tubulosus, Pourouma cecropiifolia, Pouteria macrohylla, Pouteria nemorosa, Pseudolmedia laevis, Psidium sartorianum, Pterogyne nitens, Rollinia herzogii, Sapindus saponaria, Sapium glandulosum, Schizolobium parahyba, Simira rubescens, Solanum riparium, Spondias mombin, Stylogyne ambigua, Sweetia fruticosa, Swietenia macrophylla, Tabebuia impetiginosa, Terminalia oblonga, Trema micrantha, Trichilia elegans, Urera baccifera, Urera caracassana, Zanthoxylum monogynum
- Research methods
- Leaf area: The number of leaves was counted and leaves were digitized with a desktop-scanner (Canon Lide 30). Total leaf area was determined with the help of pixel-counting software (Van Berloo 1998).
- Stem cross sectional area: Diameters were recorded at the base and the top of the stem.
- Height: Height measured from the base of the stem just above the root to the top of the stem just under the growth meristem.
- Biomass: Seedlings were dissected into roots, stems, leaves weighed and then oven-dried for 48 h at 65degC and measured again for their dry mass.
- Traits: Stem diameters at the base and top of the stem were used to calculate stem volume, which in turn together with stem mass generated an averaged stem density.
- Year collected: 2006
- Study contacts: Lars Markesteijn, Lourens Poorter
Martin1998
Data from: Martin JG, Kloeppel BD, Schaefer TL, Kimbler DL and McNulty SG (1998). Aboveground biomass and nitrogen allocation of ten deciduous southern Appalachian tree species. Canadian Journal of Forest Research, 28, pp. 1648-1659. DOI: 10.1139/x98-146.
- Site Description
- Site(s) type(s): Temperate forest
- Geography
- latitude, longitude: 35, -83
- Site(s) history: plant grown in field wild
- Experimental or sampling design
- Design characteristics: Trees were sampled in the southern Appalachian Mountains in western North Carolina at the Coweeta Hydrologic Laboratory (35°N, 83°W) as well as in an area 4 km to the south; both areas are on the Nantahala National Forest. All trees were selected from mature stands (i.e., >80 years old). Trees used in this study were selected by species, size, and location and were harvested between June and August. The range of species and sizes was selected to represent the distribution observed in over 400 permanent plots across the Coweeta Basin. Trees were selected using a stratified random design so that sample trees would represent a wide diameter range. In total, 87 individuals spanning a dbh of 3.8 to 63 cm were selected.
- Variables included: age, a.lf, a.ssbh, a.stbh, h.t, d.bh, h.bh, m.lf, m.ss, m.sh, m.sb, m.st, m.so, ma.ilf, r.st, n.lf, n.ss, n.sb, n.sh
- Species sampled: Acer rubrum L., Betula lenta L., Carya ovata (Mill.) K. Koch, Cornus florida L., Liriodendron tulipifera L., Oxydendrum arboreum (L.) DC., Quercus alba L., Quercus coccinea Muenchh., Quercus prinus L., Quercus rubra L.
- Research methods
- Leaf area: The crown was divided into 3 sections. Within each section, we selected 10 representative leaves from each of the canopy section subsamples and separated the petioles from the leaf blades. The total area of the leaf blades was measured using a leaf area meter (LI-COR 3100, LI-COR, Inc., Lincoln, Nebr.); the blades and petioles were dried (65degC) and weighed to determine SLA and the ratio of leaf blade mass to total leaf mass.
- Stem cross sectional area: Diameter of stems were measured at breast height (1.37 m). 4 cm disks were cut at base, at DBH and at crown base to determine the sapwood/heartwood area using potassium iodide to determine sapwood/heartwood boundaries.
- Height: Height was measured as the vertical distance from the ground to the highest apex and crown base.
- Crown area: Crown width was measured at right angles including the widest width. Projected area and volume were estimated by assuming an ellipse/ellipsoid.
- Biomass: Stems were divided into 1- or 2-m sections and weighed fresh. The crown was divided into thirds. Branches from each third were weighed separately and a sample branch from each third was collected for foliage mass ratio measurements. 4 cm disks were cut from the base of each log section for determination of water content as well as the bark/wood mass ratio. Samples were then dried to a constant mass at 65degC and weighed to determine moisture content.
- Traits: The ratio of leaf blade mass to total leaf mass was used to compute leaf mass per area for each crown third. Nitrogen concentration was measured on 50 leaves from each crown subsample. Branch nitrogen concentration was determined on a representative branch from each crown position subsample. For stem tissue nitrogen analysis, bark, sapwood and a 10° wedge from the remaining wood were sampled from the stem disks.
- Year collected: 1997
- Study contacts: Brian D. Kloeppel
McCulloh2010
Data from: McCulloh K, Sperry JS, Lachenbruch B, Meinzer FC, Reich PB and Voelker S (2010). Moving water well: comparing hydraulic efficiency in twigs and trunks of coniferous, ring-porous, and diffuse-porous saplings from temperate and tropical forests. New Phytologist, 186(2), pp. 439-450. DOI: 10.1111/j.1469-8137.2010.03181.x.
- Site Description
- Site(s) type(s): Temperate forest, Tropical seasonal forest
- Geography
- latitude, longitude: 45, -93; 44, -123; 9, -80
- Site(s) history: plant grown in field wild
- Experimental or sampling design
- Design characteristics: Saplings were selected that were 1-4 m in height. All saplings of a species came from similar light environments.
- Variables included: status, a.lf, a.ssba, a.stba, h.t, d.ba
- Species sampled: Abies grandis, Acer circinatum, Acer macrophyllum, Alnus rubra, Anacardium excelsum, Arbutus menziesii, Cordia alliodora, Ficus insipida, Fraxinus latifolia, Luehea seemannii, Pinus ponderosa, Pseudotsuga menziesii, Quercus ellipsoidalis, Robinia pseudoacacia, Thuja plicata, Tsuga heterophylla
- Research methods
- Leaf area: For angiosperms, leaf area was measured on all leaves with either a leaf area meter (li-3100C; Li-Cor Biosciences, Lincoln, NE USA) or a flatbed scanner and the images were then analyzed using ImageJ (National Institutes of Health, Bethesda, MD, USA). For conifers, subsamples were dried for 3d in 60degC and measured using a flatbed scanner. The areas were then doubled to account for the more vertical positioning of the needles. The weights and areas were also used to calculate SLA and total leaf area.
- Stem cross sectional area: Stem cross-sectional area was measured on de-barked samples.
- Height: Height was determined by measuring the length between the ground and the highest leaf.
- Traits: Hydraulic conductivity was determined by measuring the volume flow rate of water divided by the pressure gradient inducing flow in saturated stems. Xylem vessel and tracheid diameters were also measured on cross-sections of the trunks and branches.
- Year collected: 2005, 2007
- Study contacts: Katherine McCulloh
Mokany2003
Data from: Mokany K, McMurtrie RE, Atwell BJ and Keith H (2003). Interaction between sapwood and foliage area in alpine ash (Eucalyptus delegatensis) trees of different heights. Tree Physiology, 23(14), pp. 949-958. DOI: 10.1093/treephys/23.14.949.
- Site Description
- Site(s) type(s): Temperate forest
- Geography
- latitude, longitude: -35.7, 148.5
- Site(s) history: plant grown in field wild
- Experimental or sampling design
- Design characteristics: We destructively sampled 13 suppressed trees (growing under a canopy of taller dominant trees) with heights ranging from 2.3 to 35.1 m, plus eleven dominant trees (forming the canopy of a stand with direct access to sunlight) with heights ranging from 2.6 to 41.3 m. Each sample tree was felled and a range of measurements undertaken.
- Variables included: status, age, a.lf, a.ssba, a.shba, a.stba, h.t, h.c, d.ba, c.d, m.lf
- Species sampled: Eucalyptus delegatensis
- Research methods
- Leaf area: The basal diameters of all primary branches on each tree were measured, and foliage mass for each tree estimated using an existing allometric relationship between branch diameter and foliage mass. Once the foliage dry mass for each branch on each tree had been estimated by applying the existing allometric relationship, the estimated foliage dry masses were totalled for each tree. Specific leaf area was determined for three groups of leaves; namely, adult, juvenile and intermediate morphologies; in each group, the area of 100 fresh leaves was measured with a Model 3100 area meter (Li-Cor, Lincoln, NE), and leaf dry mass determined. Whole-tree foliage area was then determined by multiplying the total foliage mass for each tree by the relevant specific leaf area value for the leaves on that tree (e.g., the juvenile SLA value for trees composed of juvenile leaves).
- Stem cross sectional area: Two stem disks (about 4 cm thick) were taken from each tree, one at the base of the stem (BH = basal height about 40 cm above ground level) and the other at the BLC. After sanding each disk with coarse and then fine sandpaper, sapwood was clearly distinguishable from heartwood by its lighter color. The area of sapwood for each stem disk was traced onto tracing paper. The tracing was cut out, sprayed with paint, and its area measured with a Li-Cor Model 3100 area meter.
- Height: Each sample tree was felled and its overall height and the height to the base of the live crown (BLC) measured.
- Biomass: The basal diameters of all primary branches on each tree were measured, and foliage mass for each tree estimated using an existing allometric relationship between branch diameter and foliage mass. Once the foliage dry mass for each branch on each tree had been estimated by applying the existing allometric relationship, the estimated foliage dry masses were totalled for each tree. Leaves were dried at 80degC for 7 days for measurement of dry mass.
- Traits: Specific leaf area was determined for three groups of leaves:, adult, juvenile and intermediate morphologies. In each group, the area of 100 fresh leaves was measured with a Model 3100 area meter (Li-Cor, Lincoln, NE).
- Year collected: 2000
- Study contacts: Karel Mokany
Monserud1999
Data from: Monserud RA and Marshall JD (1999). Allometric crown relations in three northern Idaho conifer species. Canadian Journal of Forest Research, 29(5), pp. 521-535. DOI: 10.1139/x99-015.
- Site Description
- Site(s) type(s): Temperate forest
- Geography
- latitude, longitude: 48.35167, -116.835
- Site(s) history: plant grown in field wild
- Experimental or sampling design
- Design characteristics: Trees chosen purposively to represent the full range of diameters in the nine stands sampled, avoiding obvious signs of disease or insect attack. Two sampling strategies were compared. The first used antithetic sampling of branches within crown quarters; these branches were used with branch diameter measurements throughout the crown to infer whole crown mass estimates. A second strategy was to weigh the green crown by quarters and then use the sample branches to divide total mass into its components. We thus compared a bottom-up sample to a top-down disaggregation.
- Variables included: status, age, a.lf, a.ssbh, a.ssbc, a.stbh, a.cp, a.cs, h.t, h.c, d.bh, h.bh, d.cr, c.d, m.lf, m.br
- Species sampled: Pinus monticola, Pinus ponderosa, Pseudotsuga menziesii var. glauca
- Research methods
- Leaf area: Current foliage was collected from sample branches and frozen. Frozen samples were thawed and measured for projected leaf area using the Mocha image analysis program (Jandal Scientific). The sample needles where then dried in 70degC and specific leaf area was determined. SLA was then used to estimate total leaf area.
- Stem cross sectional area: Determined on sawn cross-sections with image-processing software.
- Height: Total height and height to to the crown base (lowest contiguous living whorl) was measured from the ground
- Crown area: Estimated from branch lengths, which were estimated from regressions on diameter
- Biomass: Harvested between completion of needle elongation and commencement of needle fall . Estimated by bottom-up methods from sample branches and by top-down methods from green crown weights.
- Traits: Also specific leaf area, sapwood cross-sectional area and foliated length of branches.
- Study contacts: John Marshall
Mori1979
Data from: Mori M, Inuma M, Sato A and Saito K (1979). Managements and land use in Fagus crenata natural forest region in Tohoku district. Technical Report 5, Agriculture, Forestry and Fisheries Research Council.
- Site Description
- Site(s) type(s): Temperate forest
- Geography
- latitude, longitude: NA, NA
- Site(s) history: plant grown in field wild, plantation managed
- Experimental or sampling design
- Design characteristics: Sample trees were felled in three Fagus crenata dominant stands and in one 12-years-old Cryptomeria japonica plantation in 1970s (Mori et al. 1979). The secondary Fagus stand was assumed to have been cut in 30-40 years before the survey. The natural forest on flat topology was assumed to have been selectively cut in 50 years before and that on slope have been never cut for the past 100 years. The Sample trees were selected to represent size variation of each stand. Sample trees were cut at ground level. Sample trees were treated with the stratified clip technique by cutting them into parts contained in horizontal layers of 0-2 m and at intervals of 2 m upward for the Fagus stands and 0-1m and and at intervals of 2 m upward for the Cryptomeria stand.
- Variables included: age, a.stbh, h.t, h.c, d.bh, h.bh, c.d, m.lf, m.st, m.so, m.br
- Species sampled: Acer spp., Cryptomeria japonica, Fagus crenata, Prunus spp., Quercus crispula
- Research methods
- Stem cross sectional area: Estimated from stem diameter.
- Height: Method not written.
- Biomass: Dry mass of stem, branches, and leaves were obtained (Mori et al. 1979). Details were not reported.
- Other variables: M.I. Ishihara, H. Utsugi, H. Tanouchi, and T. Hiura conducted formal search of reference databases and digitized raw data from Mori et al. (1979). Meta data was also created by M.I. Ishihara based on Mori et al. (1979). Species name and family names were converted by M.I. Ishihara according to the following references: Satake Y, Hara H (1989a) Wild flower of Japan Woody plants I (in Japanese). Heibonsha, Tokyo; Satake Y, Hara H (1989b) Wild flower of Japan Woody plants II (in Japanese). Heibonsha, Tokyo.
- Study contacts: Masae I. Ishihara, Hajime Utsugi, Hiroyuki Tanouchi, Tsutom Hiura
Mori1991
Data from: Mori S and Hagihara A (1991). Crown profile of foliage area characterized with the Weibull distribution in a hinoki (Chamaecyparis obtusa) stand. Trees - Structure and Function, 5(3), pp. 149-152. DOI: 10.1007/BF00204336.
- Site Description
- Site(s) type(s): Temperate forest
- Geography
- latitude, longitude: 35, 137
- Site(s) history: plant grown in plantation unmanaged
- Experimental or sampling design
- Design characteristics: Tree density, mean tree height and mean stem diameter at breast height (1.3 m above the ground) of the plantation were 5826 trees ha -l, 9.8 m and 9.3 cm, respectively. We selected the sample trees for spanning the size class distribution of the plantation.
- Variables included: status, a.lf, a.stbh, a.cp, h.t, d.bh, h.bh, d.cr, m.lf, m.st, m.so, m.br, m.rt, m.to
- Species sampled: Chamaecyparis obtusa
- Research methods
- Leaf area: Fresh weight of leaves contained in each 1.0 m (for larger trees) or 0.5 m (for smaller trees) thick horizontal layers was measured. Area of leaf samples taken from each layer was determined with an area metre. The foliage weight was finally converted into foliage area using the resulting specific leaf area.
- Stem cross sectional area: We measured the diameter of stem including bark.
- Height: We measured the real height after felling the sample trees.
- Crown area: The area of the vertical projection of the outermost perimeter of the crown on the horizontal plane.
- Biomass: We measured separately the mass of branches, stems, leaves, and roots.
- Traits: Specific leaf area was calculated as a ratio of sample leaf area to sample leaf fresh weight.
- Study contacts: Shigeta Mori
Morisawa1957
Data from: Morisawa M and Taira K (1957). Leaf biomass of Fagus crenata in Gumma Prefecture. Bulletin of the Forestry and Forest Products Research Institute, 95, pp. 121-127.
- Site Description
- Site(s) type(s): Temperate forest
- Geography
- latitude, longitude: 36.85, 139.02
- Site(s) history: plant grown in field wild
- Experimental or sampling design
- Design characteristics: Sampling was conducted in a natural forest that had experienced selective cutting at Takaragawa forest hydrological station, Gumma prefecture, Japan during the end of July to early August of 1954 and 1955. Trees were selected from each diameter class. Trees were cut down at the ground level and all leaves were detached.
- Variables included: a.lf, a.stbh, a.cp, h.t, h.c, d.bh, h.bh, d.cr, c.d, m.lf
- Species sampled: Fagus crenata
- Research methods
- Leaf area: Leaf area was estimated from dry mass of leaves and the average ratio of leaf area to leaf dry mass reported in Morisawa and Taira (1957). The ratio was obtained from 10 leaves randomly selected from each of 13 sampled trees. Ten leaves were traced on a paper and then the area was obtained by planimeter.
- Stem cross sectional area: Estimated from stem diameter.
- Height: Measured by measuring tape.
- Crown area: Crown area was estimated from a crown projection map.
- Biomass: Fresh mass of leaves were measured for each tree. The dry to fresh mass ratio was obtained for each of 13 sampled tree from subsamples. Ten randomly-selected subsample leaves were weighted for the fresh mass and oven-dried for 70 degreeC until the mass became constant. The average ratio of 13 trees (0.463) reported in Morisawa and Taira (1957) was used to convert fresh mass to dry mass by M.I. Ishihara.
- Other variables: M.I. Ishihara, H. Utsugi, H. Tanouchi, and T. Hiura conducted formal search of reference databases and digitized raw data from Morisawa and Taira (1957). Meta data was also created by M.I. Ishihara based on Morisawa and Taira (1957). Species name and family names were converted by M.I. Ishihara according to the following references: Satake Y, Hara H (1989a) Wild flower of Japan Woody plants I (in Japanese). Heibonsha, Tokyo; Satake Y, Hara H (1989b) Wild flower of Japan Woody plants II (in Japanese). Heibonsha, Tokyo.
- Study contacts: Masae I. Ishihara, Hajime Utsugi, Hiroyuki Tanouchi, Tsutom Hiura
Muro2006
Data from: Muro M, Saho K, Sasaki Y, Yamada Y, Inoue K and Kaneko M (2006). Project for forest absorption source measurement and enforcement of utilization system - belowground and aboveground biomass measurements. Technical Report 48, Oita Prefectural Forestry Research Institute.
- Site Description
- Site(s) type(s): Temperate forest
- Geography
- latitude, longitude: 33.25, 131.03
- Site(s) history: plant grown in field wild
- Experimental or sampling design
- Design characteristics: Sampling was conducted in a 32-38 year-old Quercus acutissima stand. Eight sample trees in a 20 m times 20 m quadrate were cut at ground level. Sample trees were treated with the stratified clip technique by cutting them into parts contained in horizontal layers of 3 m depth and stem, branches, and leaves were seperated for each layer. Roots of larger four trees among the sampled trees were excavated, and the soils were removed. Some remained roots in the soil were also excavated. Fine roots (0-0.5 cm in diameter) were also included in the sample.
- Variables included: a.stbh, d.bh, h.bh, m.rt
- Species sampled: Quercus acutissima
- Research methods
- Stem cross sectional area: Estimated from stem diameter.
- Biomass: Measured fresh mass was converted to dry mass from the ratio of dry to fresh mass. The ratio was estimated from subsamples oven-dried at 85-90 degree C.
- Other variables: M.I. Ishihara, H. Utsugi, H. Tanouchi, and T. Hiura conducted formal search of reference databases and digitized raw data from Muro et al. (2006). Based on this reference, meta data was also created by M.I. Ishihara. Species name and family names were converted by M.I. Ishihara according to the following references: Satake Y, Hara H (1989a) Wild flower of Japan Woody plants I (in Japanese). Heibonsha, Tokyo; Satake Y, Hara H (1989b) Wild flower of Japan Woody plants II (in Japanese). Heibonsha, Tokyo.
- Study contacts: Masae I. Ishihara, Hajime Utsugi, Hiroyuki Tanouchi, Tsutom Hiura
Myster2009
Data from: Myster RW (2009). Tree seedling survivorship, growth, and allocation in the Cross Timbers ecotone of Oklahoma, USA. Plant Ecology, 205(2), pp. 193-199. DOI: 10.1007/s11258-009-9609-0.
- Site Description
- Site(s) type(s): Temperate forest
- Geography
- latitude, longitude: 36.65, -97.4667
- Site(s) history: plant grown in plantation managed
- Experimental or sampling design
- Design characteristics:
- Variables included: a.lf, h.t, m.lf, m.st, m.so, m.rt, m.to
- Species sampled: Cercis canadensis, Cornus drummondii, Maclura pomifera, Quercus shumardii, Ulmus parrifolia
- Research methods
- Tree seedlings were planted in 4 different microsites and 2 different herbivory treatments. After one year in the field surviving seedlings were harvested and measured for height: leaf area and root/shoot/leaf biomass.
- Total leaf area was measured with a leaf area meter (LI-3100G ,LI-COR, Inc. Lincoln,:
- All seedlings had an initial height ofapproximately 20 cm when planted. Final height measured with a ruler.:
- Seedlings were dried at room temperature for a month in paper bages and then weighed for total leaf biomass, stem biomass and root biomass.:
- Study contacts: Randall W. Myster
Naidu1998
Data from: Naidu SL, DeLucia EH and Thomas RB (1998). Contrasting patterns of biomass allocation in dominant and suppressed loblolly pine. Canadian Journal of Forest Research, 28, pp. 1116-1124. DOI: 10.1139/x98-083.
- Site Description
- Site(s) type(s): Temperate forest
- Geography
- latitude, longitude: 35, -79
- Site(s) history: plant grown in plantation unmanaged
- Experimental or sampling design
- Design characteristics: In September 1995, 15 canopy dominant and 15 suppressed loblolly pine trees were sampled from five sites (7-45 year-old abandoned pine plantations) in the Duke forest region of North Carolina.
- Variables included: status, a.ssbh, a.ssbc, a.stbh, h.t, d.bh, h.bh, m.lf, m.ss, m.st, m.so, m.br, m.rt, m.to
- Species sampled: Pinus taeda
- Research methods
- Other variables: Saplings grown under closed canopy and canopy openness were measured using hemispherical photographs; Mean annual rainfall provided; Mean annual temperature provided.
- status: Dominant (d) trees had a majority of the live crown within or above the canopy of surrounding trees; suppressed (s) trees had a majority of the live crown located in the lower portion or below the canopy of surrounding trees.
- Diameter: Diameter of the bole was measured at 140cm above the ground and at the base of the live crown (BLC) for each tree.
- Height: Total height of each tree was measured after harvest.
- Sapwood Area and Weight: Wood was stained with ferric choride to differentiate sapwood. Discs were collected for this (and other bole component calculations) at 1m intervals along the bole). Total Sapwood area and volume was calculated and converted to mass using the specific gravity (measured) of wood samples.
- Bole weight: Total bole weight was determined by regression analysis and summing based upon component weights (see Sapwood).
- Branch weight: For each tree, four branches were sub-sampled. Diameter at the base of all branches on the tree were measured and all component weights were then regressed to diameter of branch base. Branch weight from sampled branches was estimated by cross-sectional area and length measurements of all component parts and specific gravity calculations.
- Needle weight: Needles from sampled branches were dried to constant mass and weighed. Total mass was based on regression to basal branch area.
- Leaf Area: Sub-samples of needle cohorts were taken for measurements of surface leaf area and estimates of projected leaf area.
- Root weight: The roots of four of the dominant and five suppressed individuals were excavated with a backhoe for extimations of coarse root allocation. Basal diameter of each primary lateral root was measured and the taproot was dried and weighted. Mass of lateral roots was estimated with regression.
- Study contacts: Shawna Naidu
Nakagaki1983
Data from: Nakagaki K (1983). Biomass of attached dead branches and their CO2 release in hinoki cypress and Japanese red cedar plantations. Masters thesis, Faculty of Agriculture, Nagoya University, Japan.
- Site Description
- Site(s) type(s): Temperate forest
- Geography
- latitude, longitude: 35.2, 137.57
- Site(s) history: plant grown in plantation managed
- Experimental or sampling design
- Design characteristics: The allometric relationships between different dimensions of a hinoki (Chamaecyparis obtusa (Sieb. Et Zucc.) Endl.) tree were examined on the basis of 55 destructive samples, which were collected from four different stands and whose age ranged from 12 to 59 years (Hagihara1993). Only 6 sample trees are reported here. For the rest of 49 trees see Hagihara1993, Iijima1991, Mori1991, Tanao1982, and Yamaji1991. Biomass and leaf area estimates were determined by the stratified clip technique, in which the stratum was 0.0-0.3 m, 0.3-1.3 m, 1.3-2.3 m, and at intervals of 1 m upward.
- Variables included: age, a.lf, a.stbh, a.stbc, h.t, h.c, d.bh, h.bh, c.d, m.lf, m.st, m.so, m.br, m.rt, m.to
- Species sampled: Chamaecyparis obtusa
- Research methods
- Leaf area: Leaf area was determined with area meters (Murayama NCE-3, Hayashi AAC-100, Hayashi AAM-5) on subsamles and was then extrapolatied to total leaf area using specific leaf area from each stratum and summing up each stratum. Specific leaf area was estimated from a sample of leaves used for estimating the ratio of dry/fresh weight and area. Total leaf weight was measured for each stratum.
- Stem cross sectional area: Estimated from stem diameter.
- Height: Height was measured as the vertical distance from the ground surface to the highest apex of each tree.
- Biomass: Trees were separated into roots, stems, branches and leaves, and then weighed. Sub-samples of the total fresh weight were taken and dried in ventilated ovens at 85 degC for a few days for fresh mass/dry mass estimates. The fresh biomass was converted into dry biomass estimates of roots, stem, branches and leaves per tree using the respective dry/fresh mass ratios.
- Study contacts: Akio Hagihara
Nishioka1982
Data from: Nishioka M, Umehara T and Nagano M (1982). Leaf, branch and stem biomass of composing tree species of forests near the Japanese macaque habitat on Mt. Minoh (in Japanese with title translated by Masae Ishihara). Reports on Japanese macaque on Mt. Minoh (title translated by Masae Ishihara), pp. 117-139.
- Site Description
- Site(s) type(s): Temperate forest
- Geography
- latitude, longitude: 34.853, 135.469
- Site(s) history: plant grown in field wild
- Experimental or sampling design
- Design characteristics: Sampling was conducted by Masahito Nishioka, Toru Umehara, and Masahiro Nagano in June 1979 in a secondary forest at Mt. Minoh, Japan. All trees on the 10 m x 10 m sampling plot were cut at ground level (Nishioka et al. 1982). Stem diameter and tree height were measured. Sample trees were then treated with the stratified clip technique by cutting them into parts contained in horizontal layers of 0-0.3 m, 0.3-1.3 m, 1.3-2.8 m, and at intervals of 1.5 m upward. Multiple-stemmed trees were excluded for this data paper.
- Variables included: a.lf, a.stba, a.stbh, a.stbc, h.t, h.c, d.ba, d.bh, h.bh, c.d, m.lf, m.st, m.so, m.br
- Species sampled: Abelia serrata, Castanea crenata, Clethra barbinervis, Diospyros kaki, Eurya japonica, Ilex crenata, Ilex pedunculosa, Lindera umbellata, Pieris japonica, Pinus densiflora, Prunus sp., Quercus serrata, Rhamnus crenara, Rhododendron macrosepalum, Rhus trichocarpa, Vaccinium oldhamii, Viburnum erosum
- Research methods
- Leaf area: Projected leaf area was estimated from fresh mass of leaves and leaf area/leaf mass ratios obtained from subsamples (Nishioka et al. 1982). Subsamples were collected from each layer and each tree. Leaf area was measured by a photoelectric planimeter.
- Stem cross sectional area: Estimated from stem diameter.
- Height: Measured by measuring tape.
- Biomass: Fresh mass of leaves, branches, and stem were measured separately for each layer and tree (Nishioka et al. 1982). A subsample of each organ was taken for each layer and each tree and oven-dried at 85 deg C for one week. The dry-to-fresh mass ratios of these subsamples were used to calculate total dry mass of each tree component.
- Other variables: Species name and family names were converted by M.I. Ishihara according to the following references: Satake Y, Hara H (1989a) Wild flower of Japan Woody plants I (in Japanese). Heibonsha, Tokyo; Satake Y, Hara H (1989b) Wild flower of Japan Woody plants II (in Japanese). Heibonsha, Tokyo.
- Year collected: 1979
- Study contacts: Masae I. Ishihara, Toru Umehara, Masahiro Nagano
Nouvellon2010
Data from: Nouvellon Y, Laclau JP, Epron D, Kinana A, Mabiala A, Roupsard O, Bonnefond JM, le Marie G, Marsden C, Bontemps JD and Saint-André L (2010). Within-stand and seasonal variations of specific leaf area in a clonal Eucalyptus plantation in the Republic of Congo. Forest Ecology and Management, 259(9), pp. 1796-1807. DOI: 10.1016/j.foreco.2009.05.023.
- Site Description
- Site(s) type(s): Tropical seasonal forest
- Geography
- latitude, longitude: -4.7914, 11.9822
- Site(s) history: plant grown in plantation managed
- Experimental or sampling design
- Design characteristics: Ten to fifteen trees were sampled at each date. Before each sampling campaign height and DBH were measured on six permanent plots. The diameter distribution was divided into 10-15 classes, and one tree per class was randomly selected outside the permanent plots.
- Variables included: lai, status, light, age, a.lf, a.stbh, h.t, h.c, d.bh, h.bh, c.d, m.lf, m.sb, m.st, m.so, m.br, a.ilf, ma.ilf
- Species sampled: Eucalyptus urophylla Eucalyptus grandis (clone)*
- Research methods
- Leaf area: All leaves of each of three crown sections (lower, middle and upper) were removed, and weighed. Twenty-five leaves were randomly selected in each section, and their fresh mass and area were immediately measured. These leaves were then dried at 65.8C to constant weight, and their dry weights were used in conjunction with their measured area to calculate specific leaf area for each crown section. The foliage dry weight of each crown section was calculated from the foliage fresh weight and the dry to fresh weight ratio of the sub- samples. The leaf area of each crown section was calculated as the product of foliage dry weight and specific leaf area. Tree leaf area was obtained by summing the leaf area of the three crown sections.
- Stem cross sectional area: Stem cross sectional area of each tree was calculated from DBH measurement
- Height: Sampled trees were felled and measured for total height
- Crown area: Not measured
- Biomass: The following compartments were considered: stem wood, stem bark, leaves, dead branches and living branches. The stem was cut into 1 m sections. Fresh mass of each compartment was measured on the field. Component biomass was sub-sampled to evaluate the dry matter content: one 5 cm thick cross section for each log, about 25% of each branch compartment and 25 leaves by level within the crown (bottom, middle, top). Aliquots were weighed before and after drying at 65.8C to constant weight. The dry weight of each component was calculated from measured fresh weight and the dry to fresh weight ratio of the sub-samples.
- traits: For each crown section (lower, middle and upper), twenty-five leaves were randomly selected, and their area and dry weight were measured. The tree averaged area and weight of individual leaves was estimated from the mean leaf area and weight of leaves in each crown section , weighted by the contribution of each crown section in the total tree leaf biomass.
- Other variables: The deep sandy soils are classified as Ferralic Arenosols according to the FAO (Food and Agriculture Organization) classification, with high sand (80-90%) and low clay (8-10%) and silt (2-2.5%) contents. Other information about the soils and the management of these eucalypt plantations can be found in Nouvellon et al., 2010.
- Year collected: 2004-2006
- Study contacts: Yann Nouvellon
OGrady2000
Data from: OGrady AP, Chen X, Eamus D and Hutley LB (2000). Composition, leaf area index and standing biomass of eucalypt open forests near Darwin in the Northern Territory, Australia. Australian Journal of Botany, 48(5), pp. 629-638. DOI: 10.1071/BT99022.
- Site Description
- Site(s) type(s): Savannah
- Geography
- latitude, longitude: -12.44, 131.12
- Site(s) history: plant grown in field wild
- Experimental or sampling design
- Design characteristics: Allometrics were developed for a range of species dominant in wet dry tropical savannas of the Northern Territory.
- Variables included: status, a.lf, a.stbh, d.bh, h.bh, m.lf, m.st, m.so
- Species sampled: Erythrophloem chlorostachys, Eucalyptus clavigera, Eucalyptus miniata, Eucalyptus tetrodonta, Terminalia ferdinandiana
- Research methods
- Leaf area: Leaf area was estimated by stripping all leaves from trees and determining dry weight. Leaves were dried at 65 deg C to constant weight. Specific leaf area of a subsample was estimated and a dry weight conversion factor was used to estimate total tree leaf area.
- Height: Tree height was measured with measuring tapes after the trees were felled.
- Biomass: After felling trees the stems were cut into 1 m sections and fresh weight determined. From each section a 5 cm disk was cut and a dry weight weight:fresh ratio calculated so that total stem mass could be determined. Branches were seperated into 3 size classes and the fresh weight of each size class was determined. A subset from each size class was retained for estimation of the dry weight:fresh ratio.
- Year collected: 1995
- Study contacts: Anthony P. OGrady
OGrady2006
Data from: OGrady A, Worledge D and Battaglia M (2006). Above- and below-ground relationships, with particular reference to fine roots, in a young Eucalyptus globulus (Labill.) stand in southern Tasmania. Trees, 20(5), pp. 531-538. DOI: 10.1007/s00468-006-0055-5.
- Site Description
- Site(s) type(s): Temperate forest
- Geography
- latitude, longitude: -42.82, 147.51
- Site(s) history: plant grown in plantation managed
- Experimental or sampling design
- Design characteristics: Data are for rainfed and irrigated trees. Trees were a monospecific stand of Eucalyptus globulus grown at a spacing of 3X3 meters. All allometric relationships were developed from above and below ground harvests.
- Variables included: a.lf, a.ssba, a.ssbh, a.stba, a.stbh, h.t, d.ba, d.bh, h.bh, m.lf, m.st, m.so, m.br, m.rf, m.rc, m.rt, m.to
- Species sampled: Eucalyptus globulus
- Research methods
- Leaf area: Leaf area samples were taken from each of three zones within the canopy, upper, mid and lower. A subsample of leaves from each zone was used to determine specific leaf area. Leaf area of the zone was calculated as the product of specific leaf area and leaf dry weight for each zone.
- Height: Heights were measured monthly using height poles. At the time of harvets height to the growing tip was checked using a tape measure
- Biomass: Each tree was subdivided into it components, of stem, branches, leaf area, fine roots and coarse roots. All material was dried to constant weight in a drying room at 30 deg C. Subsamples of each sample were dried at 65 deg C to constant weight, and a dry weight conversion factor was used to estimate the total dry weight.
- Year collected: 2000-2005
- Study contacts: Anthony P. OGrady
OHara1995
Data from: OHara KL and Valappil NI (1995). Sapwood-leaf area prediction equations for multi-aged ponderosa pine stands in western Montana and central Oregon. Canadian Journal of Forest Research, 25(9), pp. 1553-1557. DOI: 10.1139/x95-169.
- Site Description
- Site(s) type(s): Temperate forest
- Geography
- latitude, longitude: 46.858, -113.984; 43.71, -121.627
- Site(s) history: plant grown in field wild
- Experimental or sampling design
- Design characteristics: Sampling in two locations with similar methods. Trees from range of crown class and canopy strata were selected.
- Variables included: status, a.lf, a.ssbh, a.stbh, h.t, h.c, d.bh, h.bh, c.d
- Species sampled: Pinus ponderosa
- Research methods
- Leaf area: Leaf surface area was estimated with submersion method.
- Other variables: Sapwood was measured immediately after cutting.
- Year collected: 1994
- Study contacts: Kevin L. OHara
OHara2014
Data from: OHara K and York RA (2014). Leaf Area Development and Crown Architecture in a Giant Sequoia Spacing Study. Forest Science, 60, pp. 776-783. LINK.
- Site Description
- Site(s) type(s): Temperate forest
- Geography
- latitude, longitude: 38.867, -120.667
- Site(s) history: plant grown in plantation managed
- Experimental or sampling design
- Design characteristics: A 22-year-old spacing study was used to examine development of leaf area index (LAI) from different initial spacings in giant sequoia. Fifteen trees ages 3 to 36 yrs were dissected to develop leaf area predictions from sapwood cross-sectional area. Tree leaf area and LAI were estimated from three plots per spacing for nine spacing treatments from 2.1 to 6.1 m. Crown width and crown length measurements at 10, 16 and 22 yrs were used to assess crown architecture. Tree leaf area was greatest at low densities.
- Variables included: status, a.lf, a.ssba, a.ssbh, a.ssbc, a.stba, a.stbh, h.t, h.c, d.ba, d.bh, h.bh, c.d
- Species sampled: Sequoiadendron giganteum
- Research methods
- Leaf area: Projected leaf area based on scanned foilage samples; ranged from 1.5 to 50.2 m2.
- Stem cross sectional area: Cross-sectional area at breast height (1.37m) or base of tree.
- Height: Sample trees ranged from 0.7 to 29.4m
- Other variables: Diameter at breast height (DBH) ranged from 0 to 47.9 cm.
- Year collected: 2010
- Study contacts: Kevin L. OHara, Robert A. York
Ohtsuka2005
Data from: Ohtsuka T, Akiyama T, Hashimoto Y, Inatomi M, Sakai T, Jia S, Mo W, Tsuda S and Koizumi H (2005). Biometric based estimates of net primary production (NPP) in a cool-temperate deciduous forest stand beneath a flux tower. Agricultural and Forest Meteorology, 134, pp. 27-38.
- Site Description
- Site(s) type(s): Temperate forest
- Geography
- latitude, longitude: 36.15, 137.42
- Site(s) history: plant grown in field wild
- Experimental or sampling design
- Design characteristics: The study site is in the Takayama Forest Research Station, Institute for Basin Ecosystem Studies, Gifu University (Ohtsuka et al. 2005). One-hector permanent plot with a flux tower was created in a secondary deciduous broad-leaved forest on a west-facing slope (1395-1425 m a.s.l.). Forest floor was covered by dense dwarf bamboo. In December 1988, 24 trees were felled at the ground level near the plot. Each tree was separated into a stem and branches. There was no leaf because sampling was conducted in winter. Each stem was cut into segments at the height of 0.3 m, 1.3 m, 2.3 m height, and an interval of 2 m upward. For seven of the sampled trees, coarse roots were excavated.
- Variables included: age, a.stbh, h.t, d.bh, h.bh, m.st, m.br, m.rt
- Species sampled: Acanthopanax sciadophylloides, Acer distylum, Acer japonicum, Acer rufinerve, Acer sieboldianum, Betula ermanii, Betula platyphylla, Carpinus japonica, Magnolia obovata, Prunus sargentii, Quercus crispula, Symplocos coreana
- Research methods
- Height: Measured by measuring tape after the trees were felled.
- Biomass: Fresh weights of stem segments, branches, and coarse roots were measured (Ohtsuka et al. 2005). Measured fresh weights were converted to dry weight from the ratio of dry to fresh weights. The ratio was estimated from subsamples of stem segments, branches, and roots which were collected from each sampled tree and were oven-dried at 80 degrees C. For stem subsamples, a disc was collected at 0.3 m, 1.3 m, 2.3 m height, and an interval of 2 m upward. Branches subsamples were collected from several branches for each tree and the averaged ratio was used. For root subsample, a disc was collected at the most basal part of roots.
- Other variables: Species name and family names were converted by M.I. Ishihara according to the following references: Satake Y, Hara H (1989a) Wild flower of Japan Woody plants I (in Japanese). Heibonsha, Tokyo; Satake Y, Hara H (1989b) Wild flower of Japan Woody plants II (in Japanese). Heibonsha, Tokyo.
- Study contacts: Toshiyuki Ohtsuka
Osada0000
Data from: Osada N (Unpublished).
- Site Description
- Site(s) type(s): Tropical rainforest, Temperate forest
- Geography
- latitude, longitude: 2.59, 102.18; 35.04, 135.46
- Site(s) history: plant grown in field wild
- Experimental or sampling design
- Design characteristics: Saplings of Elateriospermum tapos were chosen in the understory of Pasoh forest. Trees of Gamblea innovans and Chengiopanax sciadophylloides were chosen in various light environments in the Kamigamo forest.
- Variables included: lai, light, a.lf, a.stba, a.stbh, a.cp, h.t, h.c, d.ba, d.bh, h.bh, d.cr, c.d, m.lf, a.ilf, ma.ilf
- Species sampled: Chengiopanax sciadophylloides (Franch. et Sav.) C.B. Shang et J.Y. Huang, Elateriospermum tapos Blume, Gamblea innovans (Siebold et Zucc.) C.B. Shang, Lowry et Frodin
- Research methods
- Leaf area: Sample trees were harvested and the number of leaves was counted. Leaf area was measured by a digital scanner in Elateriospermum tapos, and was estimated from total mass of leaves and specific leaf area of leaf discs that were collected randomly.
- Stem cross sectional area: Diameter of the main trunk at 10% of the height was measured for all species, diameter at stem base was measured for Elateriospermum tapos, and diameter at breast height was measured for Gamblea innovans and Chengiopanax sciadophylloides.
- Height: Tree height was measured using an extendible pole for all species.
- Crown area: The width and depth of each crown were measured for Gamblea innovans and Chengiopanax sciadophylloides. Widths were measured at the widest part of the crown and perpendicular to it. The projected area of the crown was calculated as an ellipse based on these two measurements.
- Biomass: Total leaf mass was measured for all species after drying.
- Year collected: 1997-1999, 2012
- Study contacts: Noriyuki Osada
Osada2003
Data from: Osada N, Takeda H, Kawaguchi H, Furukawa A and Awang M (2003). Estimation of crown characters and leaf biomass from leaf litter in a Malaysian canopy species, Elateriospermum tapos (Euphorbiaceae). Forest Ecology and Management, 177(1-3), pp. 379-386. DOI: 10.1016/S0378-1127(02)00393-6.
- Site Description
- Site(s) type(s): Tropical rainforest
- Geography
- latitude, longitude: 2.59, 102.18
- Site(s) history: plant grown in field wild
- Experimental or sampling design
- Design characteristics: Five individuals of 21.3 - 40.7 m in height were selected in the forest.
- Variables included: lai, a.lf, a.stbh, a.cp, h.t, h.c, d.bh, h.bh, d.cr, c.d, m.lf, a.ilf, ma.ilf
- Species sampled: Elateriospermum tapos Blume
- Research methods
- Leaf area: Leaf litter was collected systematically, and dry mass was recorded. Length, width, and dry mass of individual leaves from the dried leaf litter were measured. Fresh harvested leaves were scanned for leaf area using an area meter (AAM-8, Hayashi denko, Tokyo, Japan) and leaf area of the leaves from the leaf litter was estimated using the relationship between area, lenght and width.
- Stem cross sectional area: Diameter at breast height was measured.
- Height: Overall tree heights and lowest leaf heights were calculated using angle-distance measurements to the top of the tree and to the 1.5 m rod using a clinometer (Blume Leiss, Carl Leiss, Berlin).
- Crown area: Crown widths were measured at the widest part of the crown and perpendicular to it. The projected area of the crown was calculated as an ellipse based on these two measurements.
- Biomass: Standing leaf biomass was calculated by annual leaf litter biomass and mean leaf lifespan for each tree.
- Year collected: 1997-1999
- Study contacts: Noriyuki Osada
Osada2005
Data from: Osada N (2005). Branching, biomass distribution, and light capture efficiency in a pioneer tree, Rhus trichocarpa, in a secondary forest. Canadian Journal of Botany, 83(12), pp. 1590-1598. DOI: 10.1139/b05-133.
- Site Description
- Site(s) type(s): Temperate forest
- Geography
- latitude, longitude: 35.04, 135.46
- Site(s) history: plant grown in field wild
- Experimental or sampling design
- Design characteristics: A 30 * 50-m plot was established in the study area. All R. trichocarpa >0.5 m tall inside this plot were marked, and tree height, diameter of the main trunk at 10% of the height, and the width and depth of each crown were measured.
- Variables included: a.lf, a.stbh, a.cp, h.t, h.c, d.bh, h.bh, d.cr, c.d, m.lf, m.st, m.so, a.ilf, ma.ilf
- Species sampled: Rhus trichocarpa Miq.
- Research methods
- Leaf area: The numbers of branches and leaves were counted. The lengths of the rachis and petiole of all leaves were measured for all trees 0.5-3 m tall and subsampled in trees >3 m tall. Furthermore, 30 leaves were randomly collected, the lengths of the rachis and petiole were measured, and leaf area was calculated by using the image analysis software NIH image.
- Stem cross sectional area: All R. trichocarpa >0.5 m tall inside this plot were marked, and diameter of the main trunk at 10% of the height was measured.
- Height: All R. trichocarpa >0.5 m tall inside this plot were marked, and tree height was measured.
- Crown area: All R. trichocarpa >0.5 m tall inside this plot were marked,and the width and depth of each crown were measured. Widths were measured at the widest part of the crown and perpendicular to it. The projected area of the crown was calculated as an ellipse based on these two measurements.
- Biomass: Tree height and trunk diameter were measured for 23 trees of various heights (0.6 - 8.2 m) outside the plot, and these trees were harvested to measure the total stem biomass after drying at 70oC. Based on these samples, allometric equations were constructed to estimate the total stem biomass from diameter and height. Furthermore, 30 leaves were randomly collected, the lengths of the rachis and petiole were measured, and leaf area was calculated by using the image analysis software NIH image (National Institute of Health, Maryland, USA) for digitized data of photocopies of the leaves. Mass of the leaf petiole plus rachis was then measured after drying. To convert leaf area to leaf mass, two to three leaflets were collected from trees inside the plots. The area and dry mass of each leaflet were measured, and the mean specific leaf area (SLA) was calculated for each individual tree.
- Year collected: 2000
- Study contacts: Noriyuki Osada
Osunkoya2007
Data from: Osunkoya OO, Omar-Ali K, Amit N, Dayan J, Daud DS and Sheng TK (2007). Comparative height crown allometry and mechanical design in 22 tree species of Kuala Belalong rainforest, Brunei, Borneo. American Journal of Botany, 94(12), pp. 1951-1962. DOI: 10.3732/ajb.94.12.1951.
- Site Description
- Site(s) type(s): Tropical rainforest
- Geography
- latitude, longitude: 4.5, 115.1667
- Site(s) history: plant grown in field wild
- Experimental or sampling design
- Design characteristics: All trees > 5 cm in diameter in a 1 ha permamant plot were sampled.
- Variables included: status, a.stbh, a.cp, h.t, h.c, d.bh, h.bh, d.cr, c.d
- Species sampled: Aporusa elemeri, Aporusa grandistipula, Aporusa subcaudata, Chionanthus spicatusi, Dacryodes apiculata, Dillenia excelsa, Diospyros borneensis, Fordia sp., Fordia splendidissima, Horsfieldia polyspherulaa, Ixora grandifolia, Knema ashitoniia, Litsea ferrugiinea, Mallotus eucaustus, Mallotus sp., Mallotus wreyi, Noescortechinia kingii, Payena sp, Shorea parvifolia, Syzygium caudatum, Syzygium sp., Urophyllum arboreum
- Research methods
- Stem cross sectional area: Tree diameter at breast height determined, using diameter tapes.
- Height: Tree height determined using clinometers. Crown depth is the difference between tree height and fork height. Fork height itself is defined as distance between the stem base and the lowest major brach
- Crown area: Crown diameter were measured in four directions, and crown projection area estimated as a function of tree fork and crown heights and crown width; see Osunkoya et al 2007 for details.
- Year collected: 2004
- Study contacts: Olusegun O. Osunkoya
Parviainen1999
Data from: Parviainen T (1999). MSc thesis: Investigating the biomass and crown structure of mixed stand birch trees for process-based models. [In Finnish.]. University of Helsinki.
- Site Description
- Site(s) type(s): Boreal forest
- Geography
- latitude, longitude: 61.85, 24.283
- Site(s) history: plant grown in field wild
- Experimental or sampling design
- Design characteristics: 12 dominant Silver birch trees were sampled from 7 mixed stands with minimum 10% birch mixture. The trees were chosen to represent a continuum of tree height. The measurements were done in August 1996.
- Variables included: status, age, a.stbh, a.cp, h.t, h.c, d.bh, h.bh, d.cr, c.d, m.lf, m.st, m.so, m.br
- Species sampled: Betula pendula
- Research methods
- Leaf area: Leaf area estimate was based on leaf biomass (see below) and specific leaf area. SLA (projected) was measured on sample leaves (12.65 m2/kg).
- Stem cross sectional area: Stem cross sectional area was determined from sample disks taken at breast height (1.3 m) and at crown base. The cross section was calculated as a circle with radius equalling the average of the largest diameter and that perpendicular to it.
- Height: Height was measured using a tape measure on the felled trees that had been felled with minimum possible stump.
- Crown area: Before felling, the width of the crown was measured at the widest diameter and the one perpendicular to that. Crown area was calculated as an ellipsoid from mean crown width and crown length.
- Biomass: Branches were sampled systematically, taking each nth branch from the top to the bottom of the crown such that the total nr of sample branches was 10. Discs were taken from the stem at a number of heights, all including breast height and crown base. Tree-wise regression models were developed for the sample branches to estimate leaf and branch dry mass from branch diameter and distance from the tree top, which were measured from all live branches in the crown. Stem volume was calculated from the logs between the disc measurement heights by assuming the logs as cut cones. The volume was converted to stem biomass using wood density of the lower disc of each log, obtained by weighing and immersion of the disc.
- Traits: SLA = 12.6
- Year collected: 1996
- Study contacts: Annikki Mäkelä
Peri0000
Data from: Peri P (Unpublished).
- Site Description
- Site(s) type(s): Grassland
- Geography
- latitude, longitude: -50.32944, -72.37722
- Site(s) history: plant grown in field wild
- Experimental or sampling design
- Design characteristics: Three plots (replicates) of 15 x 30 m were randomly located at each study area. Within each plot, five individuals of dominant shrub, corresponding to different sizes were randomly selected. Then, the individuals were classified in different size classes to test, for the size effect on plant biomass, carbon and nutrient concentration, and nutrient allocation in plant components.
- Variables included: lai, status, a.lf, a.cp, h.t, d.cr, m.lf, m.st, m.so, m.br, m.rf, m.rc, m.rt, m.to, a.ilf, n.lf, n.ss, n.rf, n.rc
- Species sampled: Senecio filaginoides
- Research methods
- Leaf area: Leaf area (LA) of each individual size was determined by scanning the total harvested leaves per plant. The leaves were spread randomly over a transparent sheet and then scanned using a flat-bed scanner. The leaf area was determined using image analysis software (DT-Scan, Delta-T Ltd., Cambridge, UK).
- Height: Before harvesting height was measured with a tape.
- Crown area: Before harvesting, crown dimensions (the crown length at its widest point, CL; the perpendicular crown extent at the same height, CW) of each plant was measured. Crown area (CA) was calculated as CA = 3.1416 x CL/2 x CW/2.
- Biomass: Each plant was harvested during the spring growth period (November-December) corresponding to the vegetative growth peak and summer (January-February). Then, shrub plants were separated into the following components: green leaves; senesced leaves; twigs (1-2 years old); branches (> 2 years old) and roots classified as fine (diameter <1.0 mm), medium (1.0-5.0 mm) and coarse (> 5.0 mm) roots for biomass calculations and nutrient analysis. Roots from individual plants were excavated to maximum rooting depth for all size classes in circular plots centred on the base of selected plants. These roots were sorted in diameter class and weighed in fresh. Sub samples were taken for oven drying to estimate biomass.
- Traits: Samples of components were dried in a forced draft oven at 65degC to constant weight and ground in a mill containing 1 mm stainless steel screen for nutrient analysis. Nitrogen (N) content was determined using the semi-micro Kjeldahl technique.
- Year collected: 2008
- Study contacts: Pablo Luis Peri
Peri2008
Data from: Peri P and Lasagno R (2008). Secuestro de carbono en la estepa de Patagonia Sur. Actas XXIII Reunion Argentina de Ecologia (ASAE), pp. 220.
- Site Description
- Site(s) type(s): Grassland
- Geography
- latitude, longitude: -51.51222, -69.52611; -51.59389, -69.61444
- Site(s) history: plant grown in field wild
- Experimental or sampling design
- Design characteristics: Two study areas of 60 km2 (10 x 6 km) were selected representing main ecosystems for the studied dwarf-shrub species, grown at the ecological area of Magellanic steppe in Santa Cruz province, southern Patagonia, Argentina. Three plots (replicates) of 15 x 30 m were randomly located at each study area. Within each plot, five individuals of dominant dwarf-shrub corresponding to different sizes were randomly selected.
- Variables included: lai, status, a.lf, a.cp, h.t, d.cr, m.lf, m.st, m.so, m.br, m.rf, m.rc, m.rt, m.to, a.ilf, n.lf, n.ss, n.rf, n.rc
- Species sampled: Nardophyllum bryoides, Nassauvia ulicina
- Research methods
- Leaf area: Leaf area (LA) of each individual size was determined by scanning the total harvested leaves per plant. The leaves were spread randomly over a transparent sheet and then scanned using a flat-bed scanner. The leaf area was determined using image analysis software (DT-Scan, Delta-T Ltd., Cambridge, UK).
- Height: Before harvesting height was measured with a tape.
- Crown area: Before harvesting, crown dimensions (the crown length at its widest point, CL; the perpendicular crown extent at the same height, CW) of each plant was measured. Crown area (CA) was calculated as CA = 3.1416 x CL/2 x CW/2.
- Biomass: Then, dwarf-shrub plants were separated into the following components: green leaves; senesced leaves; stem and roots classified as fine (diameter <1.0 mm) and coarse (> 1.0 mm). All components from each sampled plant were weighed fresh. Roots from individual plants were excavated to maximum rooting depth for all size classes in circular plots centred on the base of selected plants. Sub samples were taken for oven drying to estimate biomass.
- Traits: Samples of components were dried in a forced draft oven at 65degC to constant weight and ground in a mill containing 1 mm stainless steel screen for nutrient analysis. Nitrogen (N) content was determined using the semi-micro Kjeldahl technique.
- Year collected: 2007
- Study contacts: Pablo Luis Peri
Peri2011
Data from: Peri P (2011). Carbon Storage in Cold Temperate Ecosystems in Southern Patagonia, Argentina. En: Biomass and Remote Sensing of Biomass (Ed. Islam Atazadeh). InTech Publisher, Croacia, pp. 213-226.
- Site Description
- Site(s) type(s): Shrubland
- Geography
- latitude, longitude: -50.34139, -71.64167
- Site(s) history: plant grown in field wild
- Experimental or sampling design
- Design characteristics: Three plots (replicates) of 15 x 30 m were randomly located at each study area. Within each plot, five individuals, of dominant shrub corresponding to different sizes were randomly selected.
- Variables included: lai, status, a.lf, a.cp, h.t, d.cr, m.lf, m.st, m.so, m.br, m.rf, m.rc, m.rt, m.to, a.ilf, n.lf, n.ss, n.rf, n.rc
- Species sampled: Juniella tridens
- Research methods
- Leaf area: Leaf area (LA) of each individual size was determined by scanning the total harvested leaves per plant. The leaves were spread randomly over a transparent sheet and then scanned using a flat-bed scanner. The leaf area was determined using image analysis software (DT-Scan, Delta-T Ltd., Cambridge, UK).
- Height: Before harvesting height was measured with a tape.
- Crown area: Before harvesting, crown dimensions (the crown length at its widest point, CL; the perpendicular crown extent at the same height, CW) of each plant was measured. Crown area (CA) was calculated as CA = 3.1416 x CL/2 x CW/2.
- Biomass: Each plant was harvested during the spring growth period (November-December) corresponding to the vegetative growth peak and summer (January-February). Then, shrub plants were separated into the following components: green leaves; senesced leaves; twigs (1-2 years old); branches (> 2 years old) and roots classified as fine (diameter <1.0 mm), medium (1.0-5.0 mm) and coarse (> 5.0 mm) roots for biomass calculations and nutrient analysis. Roots from individual plants were excavated to maximum rooting depth for all size classes in circular plots centred on the base of selected plants. These roots were sorted in diameter class and weighed in fresh. Sub samples were taken for oven drying to estimate biomass.
- Traits: Samples of components were dried in a forced draft oven at 65degC to constant weight and ground in a mill containing 1 mm stainless steel screen for nutrient analysis. Nitrogen (N) content was determined using the semi-micro Kjeldahl technique.
- Year collected: 2007
- Study contacts: Pablo Luis Peri
Petritan2009
Data from: Petritan A, Lüpke Bv and Petritan I (2009). Influence of light availability on growth, leaf morphology and plant architecture of beech (Fagus sylvatica L.), maple (Acer pseudoplatanus L.) and ash (Fraxinus excelsior L.) saplings. European Journal of Forest Research, 128(1), pp. 61-74. DOI: 10.1007/s10342-008-0239-1.
- Site Description
- Site(s) type(s): Temperate forest
- Geography
- latitude, longitude: 51.57944, 10.03639
- Site(s) history: plant grown in field wild
- Experimental or sampling design
- Design characteristics: A sample of N = 41-44 individual trees per species was randomly recorded, free of apparent damage, growing under a wide gradient of light conditions.
- Variables included: lai, light, a.lf, a.stba, a.cp, h.t, h.c, d.ba, d.cr, c.d, m.lf, a.ilf, ma.ilf
- Species sampled: Acer pseudoplatanus, Fagus sylvatica, Fraxinus excelsior
- Research methods
- Leaf area: Each sapling was divided into five horizontal layers of equal height (=1/5 of total length). A subsample of 50 randomly chosen leaves per layer (when the number was less, we took all leaves) was used for leaf area measurements with the LI-3100 Area Meter (LI-COR, Inc. 1987) and subsequent drying (at 70 C for 3 days) and weighing. For all other leaves, only dry weights were determined. Using the ratio of leaf weight to leaf area of the subsamples, we calculated for each layer the area of the rest of the leaves. The sum of the leaf areas of the individual layers made up the total leaf area of the sapling
- Stem cross sectional area: Stem cross sectional area:replace please with (stem area at base) = pi x diameter (at 10 cm above ground) x diameter (at 10 cm above ground) / 4.
- Height: is total height, measured with a tape to the nearest centimeter
- Crown area: Crown area: is the projected crown area, that was computed an ellipse area (the product of the two crown diameters with pi, divided by 4). The two crown diameters were recorded at the height of the maximal crown width (in N-S and W-E orientation).
- Biomass: we used only leaf mass, that was obtained by drying and weighing.
- traits: Specific leaf area (SLA in cm2 g-1) is ratio of total leaf area to leaf dry weight. Leaf area index (LAI in cm2 cm-2) as ratio of total leaf area to projected crown area .
- Other variables: Light availability was quantified by taking a hemispherical photo just above the uppermost leaves of every sampled sapling in mid-summer with a Nikon digital camera with fisheye lens and a self-leveling mount. Photos were processed with the Winscanopy software (Regents Instruments Inc., Sainte-Foy, Que?bec 2003). As a measure of light intensity, we used the indirect site factor (ISF) in percent of above canopy light, which is based on diffuse radiation. Under our conditions, this measure proved as a reliable proxy of total growing seasons photosynthetically active radiation as ISF and total site factor (including diffuse and direct radiation) were strongly correlated with R2 = 0.94 and p<0.001.
- Study contacts: Any Mary Petritan
Poorter1999
Data from: Poorter L (1999). Growth responses of 15 rain-forest tree species to a light gradient: the relative importance of morphological and physiological traits. Functional Ecology, 13, pp. 396-410. DOI: 10.1046/j.1365-2435.1999.00332.x.
- Site Description
- Site(s) type(s): Tropical rainforest
- Geography
- latitude, longitude: -11, -66
- Site(s) history: plant grown in common garden
- Experimental or sampling design
- Design characteristics: A growth experiment was carried out using 15 rainforest tree species. The species were grown in shade houses representing 6 light levels (3, 6, 12, 25, 50 and 100% of full light) in Riberalta, Bolivia (11 degrees S, 66 degrees W). Seedlings were germinated from seed, or collected as wildings in the forest. The seedlings were aclimated for 15 weeks (range 2-36) to the shade house before a first harvest (on average 8 seedlings per species) was carried out. A second harvest (on average 10 seedlings per species) was carried out after 23 weeks (range (12-29). The experiment was carried out in 3 batches. Plants were grown in 5 l bags.
- Variables included: light, a.lf, a.stba, a.cp, h.t, h.c, d.ba, d.cr, c.d, m.lf, m.st, m.so, m.br, m.rt, m.to, a.ilf, ma.ilf, r.st
- Species sampled: Amburana cearensis, Aspidosperma ramiflorum, Aspidosperma tambopatense, Bellucia pentamera, Berholletia excelsa, Cariniana micrantha, Cecropia ficifolia, Cedrela odorata, Cedrelinga catanaeformis, Euterpe precatoria, Pouteria sp., Schizolobium amazonicum, Swietenia macrophylla, Tachigali vasquezii, Theobroma speciosum
- Research methods
- Leaf area: For each sapling, the total leaf area and average individual leaf area were measured using photocopied images or a leaf area meter.
- Stem cross sectional area: Stem diameter was measured at the stem base using a calliper.
- Height: Height was measured as the vertical distance from the ground to the highest apex.
- Crown area: Crown width was measured at perpendicular right angles including the widest width. Projected area and volume were estimated by assuming a circle and using the average crown diameter.
- Crown length: Crown length was measured as the difference between the height and the insertion point of the lowest leaf.
- Biomass: Saplings were divided into root, stem, branches and petioles, and leaf lamina. Each compartment was dried to constant weight and weighed. Leaf petioles were not included in Total leaf mass. All parts of the saplings were weighed after being oven-dried at 70degC for at least 48 h.
- Traits: LMA was calculated using a flatbed scanner or video imaged photocopies, for all leaves, wood density was calculated as (stem + branch [if present]+ petiole mass) over stem volume.
- Year collected: 1994-1996
- Study contacts: Lourens Poorter
Portsmuth2005
Data from: Portsmuth A, Niinemets U, Truus L and Pensa M (2005). Biomass allocation and growth rates in Pinus sylvestris are interactively modified by nitrogen and phosphorus availabilities and by tree size and age. Canadian Journal of Forest Research, 35(10), pp. 2346-2359. DOI: 10.1139/x05-155.
- Site Description
- Site(s) type(s): Temperate forest
- Geography
- latitude, longitude: 59.47, 25.02; 58.86, 26.25
- Site(s) history: plant grown in field wild
- Experimental or sampling design
- Design characteristics: 2005 paper Biomass allocation and growth rates in Pinus sylvestris are interactively modified by nitrogen and phosphours availabilities and by tree size and age in the journal Canadian Journal of Forest Research
- Variables included: a.lf, a.stba, h.t, d.ba, m.lf, m.st, m.so, m.rf, m.rc, m.rt, m.to, ma.ilf, n.lf, n.rc
- Species sampled: Pinus sylvestris
- Research methods
- Leaf area: Total leaf area for each needle age-class (current, 1 year, 2 year) was calculated as the total dry mass of the needles in a specific age class divided by the age-class specific estimate of LMA. Individual needle areas were calculated from needle length and circumference, assuming a needle cross section geometry as a half-ellipse.
- Stem cross sectional area: trunk diameter from soil level cm measured with caliper
- Height: trunk height cm from soil level to the trunk top
- Biomass: ALL DRY MASS at least 48 H at 75oC
- Traits: projected leaf area from above (cm2) - measured from photograph taken above the tree; projected leaf area from side (cm2) measured from the photograph taken from the side of the tree; projected trunk area from above (cm2)-measured from photograph taken above the tree; projected trunk area from side (cm2) measured from the photograph taken from the side of the tree; projected crown area from above (cm2) measured from photograph taken above the tree leaves and woody parts together; projected crown area from side (cm2) measured from the photograph taken from the side of the tree -leaves and woody parts together; coarse root N% - method described in paper.
- Year collected: 2000
- Study contacts: Angelika Portsmuth
Portsmuth2006
Data from: Portsmuth A and Niinemets Ü (2006). Interacting controls by light availability and nutrient supply on biomass allocation and growth of Betula pendula and B. pubescens seedlings. Forest Ecology and Management, 227(1-2), pp. 122-134. DOI: 10.1016/j.foreco.2006.02.020.
- Site Description
- Site(s) type(s): Temperate forest
- Geography
- latitude, longitude: 59, 24
- Site(s) history: plant grown in glasshouse
- Experimental or sampling design
- Design characteristics: Two species Betula pendula and B. pubescens seedlings were grown in 4 different light (Light: 1- 100%, 2 - 34%, 3- 10%, 4- 5% of full sunlight) and nutrient (Nutrition: - A-control, B-low, C-medium, D-high (concentrations in the article)) availabilities.
- Variables included: light, a.lf, a.stba, h.t, d.ba, m.lf, m.st, m.so, m.rf, m.rc, m.rt, m.to, ma.ilf, n.lf
- Species sampled: Betula pendula, Betula pubescens
- Research methods
- Leaf area: All leaves were harvested and scanned fresh for leaf area using a flatbed scanner.
- Stem cross sectional area: diametr at soil level: measured with caliper.
- Height: Seedling height: height of seedling trunk from soil level to the top.
- Biomass: ALL DRY MASS at least 48 h at 75oC.
- Year collected: 1999-2000
- Study contacts: Angelika Portsmuth
Reid2004
Data from: Reid DEB, Lieffers VJ and Silins U (2004). Growth and crown efficiency of height repressed lodgepole pine; are suppressed trees more efficient? Trees, 18(4), pp. 390-398. DOI: 10.1007/s00468-003-0317-4.
- Site Description
- Site(s) type(s): Boreal forest
- Geography
- latitude, longitude: 53.19886, -117.3486
- Site(s) history: plant grown in field wild
- Experimental or sampling design
- Design characteristics: Within the gregg burn, an equal number of good and poor stands were identified from field reconnaissance based on the height of the stand (taller = good, shorter = poor). These categories were confirmed by estimating site index, with good sites having a mean SI50 of 15 and poor sites having an average SI50 of 10. At each stand 4 circular plots were randomly located and dbh of all trees within the plot measured. Of the 4 plots one was randomly selected for sampling. Trees were identified as Dominant, Co-dominant or suppressed based on their position in the canopy, and one of each class randomly selected for sampling at each site.
- Variables included: lai, status, age, a.lf, a.ssbh, a.stbh, a.cp, h.t, h.c, d.bh, h.bh, d.cr, c.d, m.lf
- Species sampled: Pinus contorta var. latifolia
- Research methods
- Leaf area: The crown of each sampled tree was collected and transported to the lab. A random sample of needles from the upper, middle and lower parts of the crown were subsampled for determination of leaf area. Subsamples were scanned fresh and then dried and weighed to determine specific leaf area for each tree.The rest of the crown was dried at 78oC until the mass stabilized and then mass recorded. Leaf area was determined by multiplying the dry mass by specific leaf area of the corresponding scanned subsample.
- Stem cross sectional area: Estimated from dbh measured with a diameter tape using the formula for the area of a circle.
- Height: Measured using a clinometer and 50m tape in the field before felling. Crown length was measured using a tape after sampled trees were felled, and used to determine height to the crown base.
- Crown area: After felling crown width was measured on felled trees.
- Biomass: The freshweight of all needles was measured. Subsamples were collected and dried at 78oC until constant weight.
- Study contacts: Douglas Reid
Ribeiro2011
Data from: Ribeiro SC, Fehrmann L, Soares CPB, Jacovine LAG, Kleinn C and de Oliveira Gaspar R (2011). Above- and belowground biomass in a Brazilian Cerrado. Forest Ecology and Management, 262(3), pp. 491-499. DOI: 10.1016/j.foreco.2011.04.017.
- Site Description
- Site(s) type(s): Savannah
- Geography
- latitude, longitude: -18.66, -44
- Site(s) history: plant grown in field wild
- Experimental or sampling design
- Design characteristics: Ten plots of 20 m x 25 m (0.05 ha) were established in a systematic grid over the forest area. The plots were separated 200 m from each other along two transect lines. On these sample plots, for all trees with DBH >5 cm the girth was tape measured, the tree height was visually estimated by experienced field crews in 0.5 m classes and species was identified.
- Variables included: status, a.stbh, h.t, d.bh, h.bh, m.lf, m.st, m.so, r.st
- Species sampled: Acosmium sp., Astronium fraxinifolium, Byrsonima coccolobifolia, Curatella americana, Eriotheca gracilipes, Erythroxylum suberosum, Lafoensia pacari, Piptocarpha rotundifolia, Plathymenia reticulata, Pouteria torta, Pterodon emarginatus, Qualea grandiflora, Qualea parviflora, Sclerolobium sp., Solanum sp., Strychnos pseudoquina, Stryphnodendron adstringens, Terminalia argentea
- Research methods
- Stem cross sectional area: The stem cross sectional area (g) was calculated as follows: g=(PI * DAP2)/40000, where dbh is in cm and g in m2.
- Height: Total tree height was visually estimated by experienced field crews in 0.5 m classes.
- Biomass: Selection of sample trees for aboveground biomass determination was prepared on the basis of data from the inventory, proportional to the species contribution to total basal area. A number of 120 trees from 18 species were destructively sampled and partitioned into the components: leaves, branches and bole. Belowground biomass was estimated per area by subsampling on 10 sample plots. Fresh weight and dryweight after drying at 70oC were recoded.
- Wood density: Two wood samples were taken from each stem disk on opposite sides. Each wood sample was volume measured by water displacement and weighed after oven drying at between 101-105 degC until weight stabilized. The basic wood density for one wood disk was calculated as an average of the two measurements per disk.
- Wood mass: Stem and branches were cut in appropriately sized pieces and weighed together using a standard balance of 150 kg capacity and 100 g division. A stem wood disk was taken from each harvested tree to determine fresh weight to dry weight relation.
- Leaf mass: All leaves of single trees were collected manually and fresh weight was recorded. A composite sample of leaves was manually collected for each individual and weighed to determine fresh weight to dry weight relation.
- Year collected: 2009
- Study contacts: Sabina C. Ribeiro
Roberts2003
Data from: Roberts SD, Dean TJ and Evans DL (2003). Family influences on leaf area estimates derived from crown and tree dimensions in Pinus taeda. Forest ecology and management, 172(2), pp. 261-270.
- Site Description
- Site(s) type(s): Temperate forest
- Geography
- latitude, longitude: 33.235, -89.05
- Site(s) history: plant grown in plantation unmanaged
- Experimental or sampling design
- Design characteristics: Seventy-three 15-yr-old Pinus taeda trees representing eight half-sib families and an unimproved check were destructively sampled from a single planting block with trees planted on a 1.5m x 3.0m spacing. Only data from 65 trees were included in the 2003 manuscript. Trees were selected from across the range of trees sizes in the block. Allocation patterns of aboveground biomass components were examined. Allometric relationships for estimating leaf area were developed and tested for family differences.
- Variables included: age, a.lf, a.stbh, a.cp, h.t, h.c, d.bh, h.bh, d.cr, c.d, m.lf, m.st, m.so, m.br
- Species sampled: Pinus taeda
- Research methods
- Leaf area: From the crowns of harvested trees, all live branches were removed from each 1-meter section and separated into current year foliage and sub-tending twigs, and previous years foliage and twigs. The total fresh weight of each of the components was recorded. A random subsample of each component was weighed fresh and retained for laboratory analysis. Approximately 20 needle fascicles from both current-year and second-year foliage were collected from each crown section and returned to the lab for determination of specific leaf area (SLA). In the laboratory, subsamples were dried to a constant weight and weighed to determine fresh mass:dry mass ratios for each component in each section. Foliage was separated from twigs to determine foliage mass:wood mass ratios for each component in each section. The fresh needle samples were separated from the fascicle sheaths and projected area was determined with an optical planimeter. The samples were then dried to constant weight and weighed to determine SLA (cm2/g). Using fresh mass:dry mass ratios, foliage mass:wood mass ratios, and SLA, a projected leaf area for both current-year and second-year foliage was calculated for each 1-m crown section. Section totals were summed to get total crown LA.
- Stem cross sectional area: Stem cross sectional areas were determined from stem diameters taken at stump height (0.3 m), 1 m, 1.37 m, and every 1 m interval up the stem. Stem diameters were measured using a diameter tape.
- Height: Stem heights were measured on standing trees prior to felling using a clinometer to measure from the base of the stem to the tallest point on the stem. Stem height was measured again after felling by stretching a tape along the length of the stem.
- Crown area: Crown projection area (CPA), the horizontal area of crown coverage, was calculated as the area of a circle with a diameter equal to mean crown width. Prior to felling, crown diameter on two axes (maximum and minimum) were measured by stretching a tape between the estimated crown edges as estimated by an observer standing several meters back from the tree.The two crown diameters were averaged to get the mean crown diameter.
- Biomass: Total dry mass of woody components (stem, branches, twigs) were determined for each 1 meter section of all destructively sampled trees. Fresh weights were determined in the field, subsamples were taken, dried, and weighed to determine total dry mass of each component.
- Traits: Height to the base of the live crown was determined prior to felling by using a clinometer to measure the height to the lowest branches in the predominant crown, i.e., disregarding individual branches that occasionally occur well below the majority of the live crown. Crown length was determined by subtracting the height to base of live crown from the total height of the tree. Crown volume was determined from crown projection area and crown length using the formula for a cone (1/3 * CPA * CRLEN). Height to mid-crown was taken as the distance from stem breast height (1.37 m) to the vertical center of leaf area, was calculated as ((HT - (0.56 * CRLEN)) - 1.37).
- Other: Addtional data is available from S Roberts upon request. This includes all the field measurements from each 1-meter section (foliage, branch, and stem masses) as well as the subsample weights, fresh weight:dry weight ratios, specific leaf areas, etc.
- Year collected: 1999
- Study contacts: Scott D. Roberts
Roberts2004
Data from: Roberts SD, Friend AL and Gerard PD (2004). The effect of large applications of nutrients from organic waste on biomass allocation and allometric relations in loblolly pine. Proc. 12th Biennial South. Silvicultural Res. Conf. Gen Tech. Rep. SRS-48. US Department of Agriculture, Forest Service, Southern Research Station, Asheville, NC, pp. 398-402. LINK.
- Site Description
- Site(s) type(s): Temperate forest
- Geography
- latitude, longitude: 32.414, -89.114
- Site(s) history: plant grown in field experimental
- Experimental or sampling design
- Design characteristics: From the crowns of harvested trees, all live branches were removed from each 1-meter section and separated into current year foliage and subtending twigs, and previous year?s foliage and twigs. The total fresh weight of each of the components was recorded. A random subsample of each component was weighed fresh and retained for laboratory analysis. Approximately 20 needle fascicles from both current-year and second-year foliage were collected from each crown section and returned to the lab for determination of specific leaf area (SLA). In the laboratory, subsamples were dried to a constant weight and weighed to determine fresh mass:dry mass ratios for each component in each section. Foliage was separated from twigs to determine foliage mass:wood mass ratios for each component in each section.
- Variables included: age, a.lf, a.stbh, a.cp, h.t, h.c, d.bh, h.bh, d.cr, c.d, m.lf, m.st, m.so, m.br
- Species sampled: Pinus taeda
- Research methods
- Leaf area: Leaf area was not estimated
- Stem cross sectional area: Stem cross sectional areas were determined from stem diameters taken at stump height (0.3 m), 1 m, 1.37 m, and every 1 m interval up the stem. Stem diameters were measured using a diameter tape.
- Height: Stem heights were measured on standing trees prior to felling using a clinometer to measure from the base of the stem to the tallest point on the stem. Stem height was measured again after felling by stretching a tape along the length of the stem.
- Crown area: Crown projection area (CPA), the horizontal area of crown coverage, was calculated as the area of a circle with a diameter equal to mean crown width. Prior to felling, crown diameter on two axes (maximum and minimum) were measured by stretching a tape between the estimated crown edges as estimated by an observer standing several meters back from the tree.The two crown diameters were averaged to get the mean crown diameter.
- Biomass: Total dry mass of woody components (stem, branches, twigs) were determined for each 1 meter section of all destructively sampled trees. Fresh weights were determined in the field, subsamples were taken, dried at 80oC, and weighed to determine total dry mass of each component.
- Traits: Height to the base of the live crown was determined prior to felling by using a clinometer to measure the height to the lowest branches in the predominant crown, i.e., disregarding individual branches that occassionally occur well below the majority of the live crown. Crown length was determined by subtracting the height to base of live crown from the total height of the tree.
- Year collected: 2001
- Study contacts: Scott D. Roberts
Rodriguez2003
Data from: Rodríguez R, Espinosa M, Hofmann G and Marchant M (2003). Needle mass, fine root and stem wood production in response to silvicultural treatment, tree size and competitive status in radiata pine stands. Forest Ecology and Management, 186(1-3), pp. 287-296. DOI: 10.1016/S0378-1127(03)00300-1.
- Site Description
- Site(s) type(s): Temperate forest
- Geography
- latitude, longitude: -34.15, -71.88
- Site(s) history: plant grown in field experimental
- Experimental or sampling design
- Design characteristics: In permanent plots, diameter at breast height was measured in all trees to obtain diametric amplitude in each treatment. The trees of each treatment were then divided into three equal amplitude classes, representing the intermediate, codominant and dominant crown classes. For each treatment and crown classes, three trees were selected randomly. This gives nine trees per treatment, making a total of 36 trees in the entire sample.
- Variables included: status, a.ssbh, a.stbh, h.t, d.bh, h.bh, m.lf, m.sb, m.st, m.so, m.br, m.rf, m.rc, m.rt, m.to
- Species sampled: Pinus radiata
- Research methods
- Leaf area: Leaf area was determined with a Li-Cor 3100 measuring device, using a subsample of 12 needles which were subsequently dried at 100oC for 24 hours and weighed with a precision of 0.01 g. The sum of the sections constitutes the leaf area of the tree (projected leaf area).
- Stem cross sectional area: Disks of 2 to 3 cm of width at diameter at breast height (Dbh), and after that every 3.5 m, include a disk at the base of the live crown. The disks were photographed with a digital camera in the laboratory. Each disk was placed on an aluminum platform, where the digital camera was mounted. Measurements of hertwood and total area were made using digital photographs and georeferred using Arcinfo 7.2 NT software. This allowed to estimate the sapwood area at Dbh level by difference.
- Height: Felling trees were measured directely using instrument.
- Crown area: Before felling crown projection in all four cardinal direction were measured. Crown areas were estimated assuming a conic shape of the crowns with a height H and a radius equal to the mean crown radius where the crown was widest.
- Biomass: Dry mass of the crown was estimated from the proportions of dry mass of each crown component and the total green mass of each section measured of the crown in the field. Wood and bark biomass as the product between the volume and anhydride density. Root biomass as the product of the potentially available areas for root mass and soil area samples. The sum of all trees components gives the dry mass of the tree.
- Traits: Silvopastoral in cluster and bands and 185 trees/ha. Forestry plantations at 490 trees/ha.
- Other variables: Prairies
- Year collected: 2002
- Study contacts: Rolando Rodríguez
Roeh1997
Data from: Roeh RL and Maguire DA (1997). Crown profile models based on branch attributes in coastal Douglas-fir. Forest Ecology and Management, 96(1-2), pp. 77-100. DOI: 10.1016/S0378-1127(97)00033-9.
- Site Description
- Site(s) type(s): Temperate forest
- Geography
- latitude, longitude: 46.2, -122.9; 48.3, -121.9; 48.7, -124.2; 46.054, -123.063
- Site(s) history: plant grown in plantation managed
- Experimental or sampling design
- Design characteristics: From each plot, nine to ten undamaged trees were selected for intensive crown measurements.
- Variables included: a.lf, a.ssbh, a.ssbc, a.stbh, h.t, h.c, d.bh, h.bh, c.d, m.lf
- Species sampled: Pseudotsuga menziesii
- Research methods
- Leaf area: Unknown
- Stem cross sectional area: From diameter at breast height to the nearest 1mm
- Height: Total tree height to the nearest 0.02m
- Biomass: Unknown
- Traits: Unknown
- Study contacts: Douglas A. Maguire
Roth2007
Data from: Roth BE, Jokela EJ, Martin TA, Huber DA and White TL (2007). Genotype x environment interactions in selected loblolly and slash pine plantations in the Southeastern United States. Forest Ecology and Management, 238(1-3), pp. 175-188. DOI: 10.1016/j.foreco.2006.10.010.
- Site Description
- Site(s) type(s): Temperate forest
- Geography
- latitude, longitude: 29.77, -81.42; 29.47, -82.55; 31.22, -81.95
- Site(s) history: plant grown in field experimental
- Experimental or sampling design
- Design characteristics: Within each harvest year, sample trees free of damage and disease, were selected at random from across the diameter distribution representative of each treatment and site. Prior to harvest, an inventory was completed on each sample tree consisting of HT, DBH, diameter at ground line, and crown width at the widest point parallel to, and perpendicular to the planting bed. Sample trees were felled at ground line using a hand saw, placed on a tarp and separated into four aboveground components: foliage, branches, stem and dead branches.
- Variables included: age, a.lf, a.stba, a.stbh, a.cp, h.t, h.c, d.ba, d.bh, h.bh, d.cr, c.d, m.lf, m.sb, m.st, m.so, m.br, m.rc, ma.ilf
- Species sampled: Pinus elliottii, Pinus taeda
- Research methods
- Leaf area: In the age 2 data, we used the foliage biomass data and specific needle area data to calculate all sided leaf area/tree. In the paper we calculated leaf area at the stand level using litterfall data and SNA.
- Height: Total height (HT) was measured on every tree at ages 2 and 3, but was limited to a representative 20% sub-sample at age 5. Individual tree HT at age 5 was determined from site and treatment specific HT versus DBH relationships developed from this sub-sample.
- Biomass: The total fresh weight of each component was measured separately in the field. The fraction of bark to stem components was estimated from 6 cm disks of wood, cut from the base of each ofthree equally spaced stem segments along the full length of the stem. Bark was separated from each disk and the fresh weight of each was determined in the field. Tissue samples were transported from the field and dried to a constant weight at 70o C. Litter was almost exclusively pine foliage (> 98%) and was separated from other pine material (branch, bark, twigs and cones), oven dried at 70C and weighed to the nearest 0.1 g.
- Traits: Needlefall (NF) was collected an average of six times per year over a three year period (June 2003 to February 2007) to estimate leaf area index (projected LAI). Within each family measurement plot, six circular littertraps (1.0 m2 each) were deployed, with half randomly positioned along the bed and inner bed positions. Specific leaf area (m2 g-1) was determined using the volume displacement method (Johnson, 1984) on foliar samples that were collected from individual families in the fall of 2003
- Other variables: Annual measurements of DBH were made at ages 2, 3, and 5 years on all trees in the measurement plots.
- Study contacts: Eric J. Jokela
Saito1981
Data from: Saito M (1981). Estimation of biomass of natural Cryptomeria stand in the Sado experimental forest. Bulletin of Niigata University Forest, 14, pp. 107-114.
- Site Description
- Site(s) type(s): Temperate forest
- Geography
- latitude, longitude: 38.2, 138.4
- Site(s) history: plant grown in field wild
- Experimental or sampling design
- Design characteristics: Sample trees were felled in August 1976 near the 1-ha permanent plot in a natural Cryptomeria japonica forest (760 m a.s.l.) located in the compartment 6, sub-compartment 1 of the Sado Experimental Forest of Niigata University, Japan. Trees were selected to cover various size classes. Tree age was estimated from the number of annual rings at the height of tree cut. Sample trees were treated with the stratified clip technique by cutting them into parts contained in horizontal layers of 1 m depth. Tree segment in each layer was divided into stem, branches, and needles. Green branches are all categorized as needles.
- Variables included: age, a.stbh, h.t, d.bh, h.bh, m.lf, m.st, m.so, m.br
- Species sampled: Cryptomeria japonica
- Research methods
- Stem cross sectional area: Estimated from stem diameter.
- Height: Method not reported.
- Biomass: Measured fresh mass was converted to dry mass from the ratio of dry to fresh mass. The ratio was estimated from subsamples taken at the base of stem segment, or subsample of ca. 2 kg for branches and needles. Subsamples were weighted for their fresh mass, oven-dried at 80 deg C for 24-72 h, and weighted for dry mass.
- Other variables: M.I. Ishihara, H. Utsugi, H. Tanouchi, and T. Hiura conducted formal search of reference databases and digitized raw data from Saito (1981). Based on this reference, meta data was also created by M.I. Ishihara. Species name and family names were converted by M.I. Ishihara according to the following references: Satake Y, Hara H (1989a) Wild flower of Japan Woody plants I (in Japanese). Heibonsha, Tokyo; Satake Y, Hara H (1989b) Wild flower of Japan Woody plants II (in Japanese). Heibonsha, Tokyo.
- Study contacts: Masae I. Ishihara, Hajime Utsugi, Hiroyuki Tanouchi, Tsutom Hiura
Salazar2010
Data from: Salazar S, Sanchez LE, Galindo P and Santa-Regina I (2010). Above-ground tree biomass equations and nutrient pools for a paraclimax chestnut stand and for a climax oak stand in the Sierra de Francia Mountains, Salamanca, Spain. Scientific Research and Essays, 5(11), pp. 1294-1301.
- Site Description
- Site(s) type(s): Woodland
- Geography
- latitude, longitude: 40.5761, -5.953
- Site(s) history: plant grown in field wild
- Experimental or sampling design
- Design characteristics: Fourteen representative trees of different diameter classes were felled to establish their aboveground biomass: seven Fagus sylvatica trees and seven Pinus sylvestris trees. Each tree thud hsrvested was divided into trunk, branches and leaves.
- Variables included: status, a.stbh, h.t, d.bh, h.bh, m.lf, m.st, m.so, m.br
- Species sampled: Castanea sativa, Quercus pyrenaica
- Research methods
- Leaf area: Leaf area was not measured
- Stem cross sectional area: The DBH of all trees in 1 ha surface on each experimental plot was measured.
- Height: The height of all trees in 1 ha surface was measured for each tree species using a measuring tape.
- Crown area:
- Biomass: Tree compartments (trunk, branches and leaves) were partitioned and then dried to be weighted. The trunks were separated into sections, according to their height (0-1.30 m, 1.30-3 m, 3-5 m, 5-7 m).
- traits: Representative biomass and litter samples were ground for chemical analyses. Total carbon and nitrogen were determined using a Wosthoff carmograph and Macro-N Heraeus analyzer, respectively.
- Other variables:
- Year collected: 2001-2005
- Study contacts: Ignacio Santa-Regina
SaldanaAcosta2009
Data from: Saldaña-Acosta A, Meave JA and Sánchez-Velásquez LR (2009). Seedling biomass allocation and vital rates of cloud forest tree species: Responses to light in shade house conditions. Forest Ecology and Management, 258(7), pp. 1650-1659. DOI: 10.1016/j.foreco.2009.07.027.
- Site Description
- Site(s) type(s): Tropical rainforest
- Geography
- latitude, longitude: 19.583, -104.2833
- Site(s) history: plant grown in glasshouse
- Experimental or sampling design
- Design characteristics: Of the 90 tree species of the cloud forest in the Sierra de Manantlán Biophere Reserve, Jalisco State, western Mexico we selected eight trees species common in the understory. Mature seeds of these 8 species were collected from natural populations and germinated.
- Variables included: light, a.lf, h.t, m.lf, m.st, m.so, m.rt, m.to, ma.ilf
- Species sampled: Citharexylum mocinnii, Dendropanax arboreus, Fraxinus uhdei, Juglans major, Magnolia iltisiana, Persea hintonii, Quercus salicifolia, Symplococarpon purpusii
- Research methods
- Leaf area: All leaves were scanned for leaf area using the SigmaScan Pro1 5 software (SPSS Inc., 1999); veins were included. Leaves were then dried at 80oC and SLA was be calculated. Data of SLA and leaf mass is absent in the database for species which lose their leaves seasonally (e.g. Juglans).
- Height: Height was measured for each seedling from the ground surface to the stem apex.
- Biomass: Seedlings were divided in stems, leaves (with petioles) and roots; 10 seedlings per species (5 in Quesal) were randomly harvested at 45 day intervals ( 5 times), 225 days in total. Plant material was then dried at 80oC for at least 48 hours and weighed.
- Other variables: Four levels of PAR were used: 3-5% of PAR (a), 8-10% of PAR (b), 18-20% of PAR (c ), 55-60% of PAR (d).
- Year collected: 2004
- Study contacts: Angela Saldaña-Acosta
SantaRegina0000
Data from: Regina IS (Unpublished).
- Site Description
- Site(s) type(s): Woodland
- Geography
- latitude, longitude: 40.577, -5.9494
- Site(s) history: plant grown in field wild
- Experimental or sampling design
- Design characteristics: Eleven Castanea sativa and Quercus pyrenaica trees representative of different diameter at breast height (DBH) classes were felled to establish their aboveground biomass. Each tree harvested was divided into trunk, branch and leaves.
- Variables included: status, a.stbh, h.t, d.bh, h.bh, m.lf, m.st, m.so, m.br
- Species sampled: Castanea sativa, Quercus pyrenaica
- Research methods
- Leaf area: Leaf area was measured on a subsample of leaves and total leaf mass was used to calculate total leaf area.
- Stem cross sectional area: The DBH of all trees in 1 ha surface on each experimental plot was measured.
- Height: The height of all trees in 1 ha surface was measured for each tree species using a measuring tape.
- Biomass: The trunks were separated into sections, according to their height (from 0-1.30, 1.30-3, 3-5, 5-7 m, and so on) and weighed. The wood was separated from the leaves. Sub-samples were brought to the laboratory for further analyses; moisture content was measured after drying to constant weight at 80degC.
- Traits: Representative biomass and litter samples were ground for chemical analyses. Total carbon and nitrogen were determined using a Wosthoff carmograph and Macro-N Heraeus analyzer, respectively.
- Year collected: 1995-2005
- Study contacts: Ignacio Santa-Regina
SantaRegina1999
Data from: Regina IS and Tarazona T (1999). Organic matter dynamics in beech and pine stands of mountainous Mediterranean climate area. Annals of Forest Science, 56(8), pp. 667-677. DOI: 10.1051/forest:19990804.
- Site Description
- Site(s) type(s): Temperate forest
- Geography
- latitude, longitude: 42.33, -3.183
- Site(s) history: plant grown in field wild
- Experimental or sampling design
- Design characteristics: Fourteen representative trees of different diameter classes were felled to establish their aboveground biomass: seven Fagus sylvatica trees and seven Pinus sylvestris trees. Each tree thud hsrvested was divided into trunk, branches and leaves.
- Variables included: status, a.stbh, h.t, d.bh, h.bh, m.lf, m.st, m.so, m.br
- Species sampled: Fagus sylvatica, Pinus sylvestris
- Research methods
- Leaf area: Leaf area was not measured.
- Stem cross sectional area: The DBH of all trees in 1 ha surface on each experimental plot was measured.
- Height: The height of all trees in 1 ha surface was measured for each tree species using a measuring tape.
- Biomass: Tree compartments (trunk, branches and leaves) were partitioned and then dried at 80oC to be weighted. The trunks were separated into sections, according to their height (0-1.30 m, 1.30-3 m, 3-5 m, 5-7 m).
- Traits: Representative biomass and litter samples were ground for chemical analyses. Total carbon and nitrogen were determined using a Wosthoff carmograph and Macro-N Heraeus analyzer, respectively.
- Study contacts: Ignacio Santa-Regina
Sato1971
Data from: Sato A, Kato R and Mori M (1971). Growth analysis on the old-growth natural stands of Pinus densiflora. Bulletin of the Japan Forest Society, 82, pp. 180-182.
- Site Description
- Site(s) type(s): Temperate forest
- Geography
- latitude, longitude: 39, 141
- Site(s) history: plant grown in field wild
- Experimental or sampling design
- Design characteristics: Sample trees were felled in a naturally regenerated Pinus densiflora stand (ca. 120 years old, 270 a.s.l.) located in the Touzanmatsu Experimental Forest, Iwate, Japan. Sample trees were divided into stem, branches, and needles.
- Variables included: a.stbh, h.t, h.c, d.bh, h.bh, c.d, m.lf, m.st, m.so, m.br
- Species sampled: Pinus densiflora
- Research methods
- Stem cross sectional area: Estimated from stem diameter.
- Height: Method not reported.
- Biomass: Measured fresh mass was converted to dry mass from the ratio of dry to fresh mass. The ratio was estimated from subsamples. Detailed method not reported.
- Other variables: M.I. Ishihara, H. Utsugi, H. Tanouchi, and T. Hiura conducted formal search of reference databases and digitized raw data from Sato et al. (1971). Based on this reference, meta data was also created by M.I. Ishihara. Species name and family names were converted by M.I. Ishihara according to the following references: Satake Y, Hara H (1989a) Wild flower of Japan Woody plants I (in Japanese). Heibonsha, Tokyo; Satake Y, Hara H (1989b) Wild flower of Japan Woody plants II (in Japanese). Heibonsha, Tokyo.
- Study contacts: Masae I. Ishihara, Hajime Utsugi, Hiroyuki Tanouchi, Tsutom Hiura
Satoo1968
Data from: Satoo T (1968). Primary production and distribution of produced dry matter in a plantation of Cinnamomum camphora : Materials for the studies of growth in stands. Bulletin of the Tokyo University Forests, 64, pp. 241-275.
- Site Description
- Site(s) type(s): Temperate forest
- Geography
- latitude, longitude: 35.2, 140.1
- Site(s) history: plant grown in plantation managed
- Experimental or sampling design
- Design characteristics: Sampling was conducted in a Cinnamomum camphora plantation (200 m a.s.l.) located in the section b, compartment 17 of the University of Tokyo Chiba Forest. Trees were planted in 1910 and the sampling was conducted in July 1956, thus ca. 46 years old. At the time of sampling, leaves were fully developed. Sample trees were selected according to the URLICH-II method. After cutting trees, tree height and the height of branches were measured. Each sample tree was divided into leaves, branches, and stem. Branches were further divided into current year branches, the older branches below 1 cm in diameter, those from 1 to 5 cm, and those above 5 cm.
- Variables included: a.lf, a.stbh, h.t, d.bh, h.bh, m.lf, m.st, m.so, m.br
- Species sampled: Cinnamomum camphora
- Research methods
- Leaf area: Leaves were mixed and subsamples of 20-30 g were taken for each tree. Leaf area of the subsample leaves were measured by the dot-counting method (Negishi et al. 1957 J. Jp. For. Soc. 39: 380-384) before the subsample was oven-dried. Then total leaf area of a tree was estimated from total dry mass and the ratio of leaf area to dry mass of subsampled leaves.
- Stem cross sectional area: Estimated from stem diameter.
- Height: Measured after trees were cut down.
- Biomass: Measured fresh mass of leaves or braches was converted to dry mass from the ratio of dry to fresh mass. Leaves were weighted for fresh mass, mixed, and subsamples of 20-30 g were taken. Leaf area and fresh mass of these subsample leaves were measured before oven-drying at 85 deg C for 48 h and weighting for dry mass. Subsample of current year branches were collected similarly and oven-drying at 85 deg C for 72 h. For the older branches below 1 cm in diameter, subsamples of 25-85 g were taken. For the older branches 1-5 cm, 2-10 discs were taken. For the older branches above 5 cm, discs were taken from all branches at an interval of 1 m. Stem dry mass was estimated from stem volume using the bulk density determined for stem discs taken at the height of 0, 0.3, 1.3m, at the interval of 2 m upward to the base of crown, and at the interval of 1 m upward. Average bulk density of 0.585 was used. Stem volume was determined by the stem analysis.
- Other variables: M.I. Ishihara, H. Utsugi, H. Tanouchi, and T. Hiura conducted formal search of reference databases and digitized raw data from Satoo (1968). Based on this reference, meta data was also created by M.I. Ishihara. Species name and family names were converted by M.I. Ishihara according to the following references: Satake Y, Hara H (1989a) Wild flower of Japan Woody plants I (in Japanese). Heibonsha, Tokyo; Satake Y, Hara H (1989b) Wild flower of Japan Woody plants II (in Japanese). Heibonsha, Tokyo.
- Study contacts: Masae I. Ishihara, Hajime Utsugi, Hiroyuki Tanouchi, Tsutom Hiura
Satoo1974a
Data from: Satoo T, Negisi K and Yagi K (1974). Primary production relations in a plantation of Thujopsis dolabrata in Noto Peninsula: Materials for the studies of growth in forest stands. Bulletin of the Tokyo University Forests, 66, pp. 139-155.
- Site Description
- Site(s) type(s): Temperate forest
- Geography
- latitude, longitude: 37.22, 136.85
- Site(s) history: plant grown in plantation managed
- Experimental or sampling design
- Design characteristics: Sampling was conducted in three 23-42 year-old Thujopsis dolabrata plantations (I, II, III) located in Kooti, Anamizu-machi, the Noto Peninsula, Japan. Details of each stand is listed in Table 1 of Satoo et al. (1974a). Five sample trees were selected in each stand to cover a wide range of diameter and were cut down at ground level in the summer of 1963. Sample trees were treated with stratified sampling technique by cutting them into parts contained in horizontal layers of 0-0.3 m, 0.3-1.3 m, at intervals of 2 m upward. Stem, branches, new needles, and old needles were separated for each layer.
- Variables included: a.lf, a.stbh, h.t, d.bh, h.bh, m.lf, m.st, m.so, m.br
- Species sampled: Thujopsis dolabrata
- Research methods
- Leaf area: Total projected needle area was estimated from needle fresh mass and the ratio of needle area to fresh mass. Subsample of needles were collected from each layer. Projected needle area was measured with a photoelectric planimeter.
- Stem cross sectional area: Estimated from stem diameter.
- Height: Method not reported.
- Biomass: Stem mass was estimated from volume and bulk density. Stem discs collected from the base of each stem segments were used for stem analysis to obtain stem volume, and then weighted and oven-dried to obtain bulk density. Branch and needle mass was obtained from converting to fresh mass by the ratio of dry to fresh mass. Subsample of branches or needles was taken for each layer and weighted to obtain the ratio of dry to fresh mass.
- Other variables: M.I. Ishihara, H. Utsugi, H. Tanouchi, and T. Hiura conducted formal search of reference databases and digitized raw data from Satoo et al. (1974a). Based on this reference, meta data was also created by M.I. Ishihara. Species name and family names were converted by M.I. Ishihara according to the following references: Satake Y, Hara H (1989a) Wild flower of Japan Woody plants I (in Japanese). Heibonsha, Tokyo; Satake Y, Hara H (1989b) Wild flower of Japan Woody plants II (in Japanese). Heibonsha, Tokyo.
- Study contacts: Masae I. Ishihara, Hajime Utsugi, Hiroyuki Tanouchi, Tsutom Hiura
Satoo1974b
Data from: Satoo T (1974). Primary production relations in a natural forest of Betula maximowicziana in Hokkaido: Materials for the studies of growth in forest stands. Bulletin of the Tokyo University Forests, 66, pp. 109-117.
- Site Description
- Site(s) type(s): Temperate forest
- Geography
- latitude, longitude: 43.2, 142.43
- Site(s) history: plant grown in field wild
- Experimental or sampling design
- Design characteristics: Sampling was conducted in three Betula maximowicziana secondary forests (48 years old, 300-350 m a.s.l.) regenerated after a large forest fire in 1911 located in the University of Tokyo Hokkaido Forest. Sampling plot of size 20 m times 50 m were created on the upper, middle, and lowere parts of the slope (I, II, and III). Details of the sampling plots are listed in Table 1 of Satoo (1974a). Five sample trees were selected from each plot that were of average size and cut down at ground level in the summer of 1958. Sample trees were divided into stem, branches, and leaves. Stem and braches were futher separated into layers at the height of 0, 0.3, 1.3 m and the interval of 2 m upward.
- Variables included: a.lf, a.stbh, h.t, d.bh, h.bh, m.lf, m.st, m.so, m.br
- Species sampled: Betula maximowicziana
- Research methods
- Leaf area: Total leaf area was estimated from the fresh mass and the ratio of leaf area to fresh mass which was obtained from subsamples. Leaf area was measured by the dot-counting method (Negishi et al. 1957 J. Jp. For. Soc. 39: 380-384). Transpalent plate with marked dots at a certian interval such as every 1 cm was placed randomly on a leaf. Leaf area was estimated from the relationship between leaf area and the counted number of dots in the leaf.
- Stem cross sectional area: Estimated from stem diameter.
- Height: Method not reported.
- Biomass: Stem biomass was estimated by multiplying its volume with bulk density both determined from subsamples. Stem subsamples were taken at the height of 0, 0.3, 1.3 m and the interval of 2 m upward. Using the stem analysis techinque, stem volume was estimated. Branch and leaf biomass were estimated from fresh mass and the ratio of dry to fresh mass. The ratio was obtained from subsamples. Branch diameter was measured for all branches at 10 cm from their base. Branch subsample was taken at 0.5-2 m from the base of the branch for a branch having mean branch diameter in each layer. Leaf subsample were taken.
- Other variables: M.I. Ishihara, H. Utsugi, H. Tanouchi, and T. Hiura conducted formal search of reference databases and digitized raw data from Satoo (1974a). Based on this reference, meta data was also created by M.I. Ishihara. Species name and family names were converted by M.I. Ishihara according to the following references: Satake Y, Hara H (1989a) Wild flower of Japan Woody plants I (in Japanese). Heibonsha, Tokyo; Satake Y, Hara H (1989b) Wild flower of Japan Woody plants II (in Japanese). Heibonsha, Tokyo.
- Study contacts: Masae I. Ishihara, Hajime Utsugi, Hiroyuki Tanouchi, Tsutom Hiura
Satoo1974c
Data from: Satoo T (1974). Primary production relations in a plantation of Larix leptolepis in Hokkaido: Materials for the studies of growth in forest stands. Bulletin of the Tokyo University Forests, 66, pp. 119-126.
- Site Description
- Site(s) type(s): Temperate forest
- Geography
- latitude, longitude: 43.22, 142.33
- Site(s) history: plant grown in plantation managed
- Experimental or sampling design
- Design characteristics: Sampling was conducted in a Larix kaempferi plantation (21 years old, 300 m a.s.l.) located at the foothill of Mt. Asibetu in central Hokkaido, Japan. A plot of size 20 m times 30 m were created. Details of the sampling plot are listed in Table 1 of Satoo (1974c). Ten sample trees were selected to cover a wide range of diameter and cut down at ground level in the summer of 1961. Sample trees were treated with stratified sampling technique by cutting them into parts contained in horizontal layers of 0-0.3 m, 0.3-1.3 m, at intervals of 2 m upward to the crown base, and at intervals of 1 m upward.
- Variables included: age, a.stbh, h.t, d.bh, h.bh, m.lf, m.st, m.so, m.br
- Species sampled: Larix kaempferi
- Research methods
- Stem cross sectional area: Estimated from stem diameter.
- Height: Method not reported.
- Biomass: Measured fresh mass of each component (needle, branches and stem) within each layer was converted to dry mass from the ratio of dry to fresh mass. The ratio was estimated from subsamples taken from each tree for each layer. Stem discs was taken as a subsample at the base of the segment in each layer. Subsamples of branches or needles were collected for each layer.
- Other variables: M.I. Ishihara, H. Utsugi, H. Tanouchi, and T. Hiura conducted formal search of reference databases and digitized raw data from Satoo (1974c). Based on this reference, meta data was also created by M.I. Ishihara. Species name and family names were converted by M.I. Ishihara according to the following references: Satake Y, Hara H (1989a) Wild flower of Japan Woody plants I (in Japanese). Heibonsha, Tokyo; Satake Y, Hara H (1989b) Wild flower of Japan Woody plants II (in Japanese). Heibonsha, Tokyo.
- Study contacts: Masae I. Ishihara, Hajime Utsugi, Hiroyuki Tanouchi, Tsutom Hiura
Satoo1974d
Data from: Satoo T (1974). Primary production relations of a young stand of Metasequoia glyptostroboides planted in Tokyo: Materials for the studies of growth in forest stands. Bulletin of the Tokyo University Forests, 66, pp. 153-164.
- Site Description
- Site(s) type(s): Temperate forest
- Geography
- latitude, longitude: 35.739, 139.538
- Site(s) history: plant grown in plantation managed
- Experimental or sampling design
- Design characteristics: Sampling was conducted in a Metasequoia glyptostroboides plantation (17 years old, 300 m a.s.l.) in Tanashi, Tokyo, Japan. Trees were originated from rooted cuttings of two trees, thus clones. A plot of size 251 sq. m were created and stem diameter at breast height were measured. Details of the sampling plot are listed in Table 1 of Satoo (1974d). Five sample trees were selected to cover a wide range of diameter and cut down at ground level in late October 1969. Roots were surveyed in middle December of 1969. Sample trees were treated with stratified sampling technique by cutting them into parts contained in horizontal layers of 0-0.3 m, 0.3-1.3 m, at intervals of 2 m upward. Stem, branches, and needles were separated for each layer. Branches were further divided into new shoot, older branch > 1 cm in diameter, and that < 1cm. Roots were excavated and fine roots were recovered by spil block method.
- Variables included: a.lf, a.stbh, h.t, d.bh, h.bh, m.lf, m.st, m.so, m.br, m.rt, m.to
- Species sampled: Metasequoia glyptostroboides
- Research methods
- Leaf area: Total projected needle area was estimated from needle fresh mass and the ratio of needle area to fresh mass. Subsample of needles were collected from each layer. Projected needle area was measured with a photoelectric planimeter.
- Stem cross sectional area: Estimated from stem diameter.
- Height: Method not reported.
- Biomass: For aboveground, measured fresh mass of each component in a layer was converted to dry mass from the ratio of dry to fresh mass. The ratio was estimated from subsamples taken for each layer. For root mass, method was not reported.
- Other variables: M.I. Ishihara, H. Utsugi, H. Tanouchi, and T. Hiura conducted formal search of reference databases and digitized raw data from Satoo (1974d). Based on this reference, meta data was also created by M.I. Ishihara. Species name and family names were converted by M.I. Ishihara according to the following references: Satake Y, Hara H (1989a) Wild flower of Japan Woody plants I (in Japanese). Heibonsha, Tokyo; Satake Y, Hara H (1989b) Wild flower of Japan Woody plants II (in Japanese). Heibonsha, Tokyo.
- Study contacts: Masae I. Ishihara, Hajime Utsugi, Hiroyuki Tanouchi, Tsutom Hiura
Satoo1974e
Data from: Satoo T (1974). Primary production relations in a young plantation of Abies sachalinensis in Hokkaido: Materials for the studies of growth in forest stands 11. Bulletin of the Tokyo University Forests, 66, pp. 127-137.
- Site Description
- Site(s) type(s): Temperate forest
- Geography
- latitude, longitude: 43.22, 142.38
- Site(s) history: plant grown in plantation managed, field wild
- Experimental or sampling design
- Design characteristics: Sampling was conducted in a Abies sachalinensis plantation (26 years old, 230-250 m a.s.l.) located in compartment 87-E, Yamabe, the University of Tokyo Hokkaido Forest in central Hokkaido, Japan. Trees were planted in 1937. Details of the stand are listed in Table 1 of Satoo (1974e). A plot of size 0.07 ha were created. Seven sample trees were selected to cover a wide range of diameter and cut down at ground level in 1960. Stems of sample trees were cut into parts contained in horizontal layers of 0-0.3 m, 0.3-1.3 m, at intervals of 2 m upward upward. Branches were cut into layers of 1 m depth and separated into new shoots with needles, branches with old needles, braches without needles. In addition, four trees were sampled in an adjacent old-growth forest in Yamabe. Methods were the same.
- Variables included: age, a.stbh, h.t, d.bh, h.bh, m.lf, m.st, m.so, m.br
- Species sampled: Abies sachalinensis
- Research methods
- Stem cross sectional area: Estimated from stem diameter.
- Height: Method not reported.
- Biomass: Stem mass was estimated from volume and bulk density. Stem discs collected from the base of each stem segments were used for stem analysis to obtain stem volume, and then weighted and oven-dried to obtain bulk density. Branch and needle mass was obtained from converting to fresh mass by the ratio of dry to fresh mass. Subsample of each branch category (new shoots with needles, branches with old needles, braches without needles) was taken for each layer and separated into branch and needles, and weighted to assess the ratio of needles to branches and the ratio of dry to fresh mass.
- Other variables: M.I. Ishihara, H. Utsugi, H. Tanouchi, and T. Hiura conducted formal search of reference databases and digitized raw data from Satoo (1974e). Based on this reference, meta data was also created by M.I. Ishihara. Species name and family names were converted by M.I. Ishihara according to the following references: Satake Y, Hara H (1989a) Wild flower of Japan Woody plants I (in Japanese). Heibonsha, Tokyo; Satake Y, Hara H (1989b) Wild flower of Japan Woody plants II (in Japanese). Heibonsha, Tokyo.
- Study contacts: Masae I. Ishihara, Hajime Utsugi, Hiroyuki Tanouchi, Tsutom Hiura
Segawa1969
Data from: Segawa K and Kato R (1969). Growth of Quercus serrata coppice forest in Koma Experimental Forest. Technical Report 11, Touhoku Research Center, Forestry and Forest Products Research Institute.
- Site Description
- Site(s) type(s): Temperate forest
- Geography
- latitude, longitude: 39.87, 141.15
- Site(s) history: plant grown in field wild
- Experimental or sampling design
- Design characteristics: Sample trees were felled in two Quercus serrata secondary forests at Koma Experimental Forest, Iwate, Japan in September of 1968 for stand 4 and of 1969 for stand 5. Trees were selected to represent size classes. Sample trees were then treated with the stratified clip technique by cutting them into parts contained in horizontal layers and separated into stem, branches, leaves, and seeds.
- Variables included: age, a.lf, a.stbh, h.t, h.c, d.bh, h.bh, c.d, m.lf, m.st, m.so, m.br
- Species sampled: Quercus serrata
- Research methods
- Leaf area: Total leaf area was estimated from fresh mass and the ratio of leaf area to fresh mass. Leaf area of 30 randomly sampled leaves was measured by the dot-counting method (Negishi et al. 1957 J. Jp. For. Soc. 39: 380-384).
- Stem cross sectional area: Estimated from stem diameter.
- Height: Method not reported.
- Biomass: Measured fresh mass was converted to dry weight from the ratio of dry to fresh mass. The ratio was estimated from subsamples taken for each layer. For stem subsample, stem discs were collected. All subsamples were oven-dried at 80-85 deg. C.
- Other variables: M.I. Ishihara, H. Utsugi, H. Tanouchi, and T. Hiura conducted formal search of reference databases and digitized raw data from Segawa and Kato (1969). Based on this reference, meta data was also created by M.I. Ishihara. Species name and family names were converted by M.I. Ishihara according to the following references: Satake Y, Hara H (1989a) Wild flower of Japan Woody plants I (in Japanese). Heibonsha, Tokyo; Satake Y, Hara H (1989b) Wild flower of Japan Woody plants II (in Japanese). Heibonsha, Tokyo.
- Study contacts: Masae I. Ishihara, Hajime Utsugi, Hiroyuki Tanouchi, Tsutom Hiura
Segawa1973
Data from: Segawa K, Kato R and Yoshimura K (1973). Populus plantation at mountainous area. Growth and biomass at Terada Experimental stand. Touhoku Research Center, Forestry and Forest Products Research Institute.
- Site Description
- Site(s) type(s): Temperate forest
- Geography
- latitude, longitude: 40, 141.1
- Site(s) history: plant grown in plantation managed
- Experimental or sampling design
- Design characteristics: Sample trees were hybrid poplar of three strains (first three trees are Kamabuchi, second three are I-154, and last three are I-214) planted in Terada Experimental Site, Iwate, Japan (340 m a.s.l.) 14 years befores. Sample trees were selected to represent size classes. Sample trees were then treated with the stratified clip technique by cutting them into parts contained in horizontal layers and separated into stem, branches, and leaves.
- Variables included: a.lf, a.stbh, h.t, h.c, d.bh, h.bh, c.d, m.lf, m.st, m.so, m.br
- Species sampled: Populus x euramericana
- Research methods
- Leaf area: Total leaf area was estimated from fresh mass and the ratio of leaf area to fresh mass. Thirty leaves were selected randomly from the upper, middle and lower crown and their leaf areas were measured by the automatic planimeter.
- Stem cross sectional area: Estimated from stem diameter.
- Height: Method not reported.
- Biomass: Measured fresh mass of each component was converted to dry mass from the ratio of dry to fresh mass. The ratio was estimated from subsamples taken from each layer. Stem discs were collected from each layer as subsamples. Subsamples were oven-dried at 82 deg C.
- Other variables: M.I. Ishihara, H. Utsugi, H. Tanouchi, and T. Hiura conducted formal search of reference databases and digitized raw data from Segawa et al. (1969). Based on this reference, meta data was also created by M.I. Ishihara
- Study contacts: Masae I. Ishihara, Hajime Utsugi, Hiroyuki Tanouchi, Tsutom Hiura
Selaya2010
Data from: Selaya NG and Anten NPR (2010). Leaves of pioneer and later-successional trees have similar lifetime carbon gain in tropical secondary forest. Ecology, 91, pp. 1102-1113. DOI: 10.1890/08-2111.1.
- Site Description
- Site(s) type(s): Tropical rainforest
- Geography
- latitude, longitude: -11, -66
- Site(s) history: plant grown in plantation unmanaged
- Experimental or sampling design
- Design characteristics: A plot of 0.7 ha was established in a 0.5, 2 and 3 y/o secondary forest at a minimal distance of 20 m from the edge of this forest stand (beyond this there was primary forest). Ten to 20 individuals (all had grown from seed) per species were selected such that bracketed the height range at which each occurred in the plot.
- Variables included: lai, status, light, age, a.lf, a.stbh, h.t, h.c, d.bh, h.bh, c.d, m.lf, m.st, m.so, m.br, a.ilf, ma.ilf, r.st, n.lf
- Species sampled: Adenocalymma impressum, Brosimum lactescens, Cecropia ficifolia, Combretum gracilis, Couratari guianensis, Ochroma pyramidale, Pseudolmedia laevis, Rinereocarpus uleii, Trema micrantha, Uncaria guianensis
- Research methods
- Leaf area: Digital photographs of representative leaves were taken and scanned for leaf area using the software Sigma Scan Pro 5. The leaves were then dried at 70oC for 5 days to obtain SLA. Specific leaf area was used to calculate total leaf area.
- Stem cross sectional area: Calculated from diameter measurements at .3 and 1.3 m height
- Height: Destructively : trees were cut at the base allowing direct height measurements
- Crown area: Crown diameter was measured visually in two directions
- Biomass: Individuals were harvested and clipped into 25 cm sections. Stem branches, petioles and foliage were put in separate bags and dried at 70oC for 5 days.
- Traits: Wood density: green volume by water displacement and then dry weight; Leaf angle using protractor; Leaf N content with Kjehldahl method; Tree LAI measured with a LI2000.
- Year collected: 2003
- Study contacts: Niels Anten, N. Galia Selaya
Sillett2010
Data from: Sillett SC, Van Pelt R, Koch GW, Ambrose AR, Carroll AL, Antoine ME and Mifsud BM (2010). Increasing wood production through old age in tall trees. Forest Ecology and Management, 259(5), pp. 976-994. DOI: 10.1016/j.foreco.2009.12.003.
- Site Description
- Site(s) type(s): Temperate forest
- Geography
- latitude, longitude: -37, 145; 40, -123.8
- Site(s) history: plant grown in field wild
- Experimental or sampling design
- Design characteristics: Dominant and co-dominant trees of 3 height classes were selected for detailed study from the tallest conifer-dominated and angiosperm-dominated forests including the tallest known individuals. Each trees main trunk and all appendages were mapped nondestructively in a 3D framework and then re-mapped exactly 1 year later to quantify growth. Increment cores were collected at multiple heights along main trunk, and destructive sampling of appendages allowed determination of minimum tree age, biomass, aboveground structure, and annual growth.
- Variables included: status, age, a.lf, a.stbh, h.t, d.bh, h.bh, m.lf, m.st, m.so
- Species sampled: Eucalyptus regnans, Sequoia sempervirens
- Research methods
- Leaf area: Leaf area was quantified by a hierarchical subsampling procedure involving 100 % inventory of all branches on the tree. This was accomplished by climbing trees and mapping their crowns. A random sample of branches stratified by height and diameter was then destructively sampled and equations were developed to predict whole-branch quantities using data obtained during crown mapping. Leaf mass was converted to leaf area by scanning subsamples of leaves to determine SLA.
- Stem cross sectional area: Stem cross sectional areas were measured at multiple heights via tape during crown mapping.
- Height: Height was measured directly by lowering a fiberglass tape from highest leaves to average ground level.
- Biomass: Biomass was determined by hierarchical sampling beginning with 100% inventory of all aboveground structures followed by subsampling. 3D computer models ensured that there were no errors in XYZ coordinates of all woody elements in the tree. Destructive sampling, including increment coring, yielded bark, sapwood, and heartwood radii for all woody components. Subsamples were measured fresh and then dried and weighed to determine densities.
- Year collected: 2005-2007
- Study contacts: Stephen C. Sillett
Singh1980
Data from: Singh AK, Pandey VN and Misra KN (1980). Stand composition and phytomass distribution of a tropical deciduous Teak (Tectona grandis) plantation in India. Journal of the Japanese Forest Society, 62, pp. 39-159.
- Site Description
- Site(s) type(s): Tropical seasonal forest
- Geography
- latitude, longitude: 26, 83
- Site(s) history: plant grown in plantation managed
- Experimental or sampling design
- Design characteristics: Sample trees were felled in a 15 year old teak plantation in Shikarganj Block, compartment number 15A, the Chandraprabha Sanctuary, India in 1976-1977. Sampled trees were selected to represent different size classes. Trees were treated with the stratified clip technique by cutting them into parts contained in horizontal layers of 1 m depth. Stem, branches, leaves were seperated for each layer. Roots were dug out from one cubic meter volume and adhering soil was removed.
- Variables included: a.stbh, h.t, d.bh, h.bh, m.lf, m.st, m.so, m.br, m.rt, m.to
- Species sampled: Tectona grandis
- Research methods
- Stem cross sectional area: Estimated from stem diameter.
- Height: Method not reported.
- Biomass: Measured fresh weight of each component was converted to dry weight from the ratio of dry to fresh weights. The ratio was estimated from uniform representative subsamples of weight ranging between 100 and 500g. These subsamples were weighed for fresh weight and then oven-dried to constant weight at 70 deg C for 48 h, and dry weight were measured.
- Other variables: M.I. Ishihara, H. Utsugi, H. Tanouchi, and T. Hiura conducted formal search of reference databases and digitized raw data from Singh et al. (1980). Based on this reference, meta data was also created by M.I. Ishihara.
- Study contacts: Masae I. Ishihara, Hajime Utsugi, Hiroyuki Tanouchi, Tsutom Hiura
Stancioiu2005
Data from: Stancioiu PT and OHara KL (2005). Sapwood area-leaf area relationships for coast redwood. Canadian Journal of Forest Research, 35(5), pp. 1250-1255. DOI: 10.1139/x05-039.
- Site Description
- Site(s) type(s): Temperate forest
- Geography
- latitude, longitude: 39.37278, -123.6556
- Site(s) history: plant grown in field wild
- Experimental or sampling design
- Design characteristics: Redwood trees from a range of diameters and crown positions were subjectively sampled.
- Variables included: status, a.lf, a.ssbh, a.ssbc, a.stbh, h.t, h.c, d.bh, h.bh, c.d, m.lf
- Species sampled: Sequoia sempervirens
- Research methods
- Leaf area: The photosynthetic tissue was divided into five morphological types and subsamples were scanned for projected leaf area using the Regent Instruments WinSeedle software. Projected leaf area was then expanded from the scanned sample to morphological type, branch level, branch category level within crown section, crown section, entie crown and tree level. Stem cross sectional area, cross sectional area of stem section including only sapwood in cm2
- Height: Tree height from ground to tree top
- Year collected: 2000-2001
- Study contacts: Kevin L. OHara
Sterck0000
Data from: Sterck F (Unpublished).
- Site Description
- Site(s) type(s): Temperate forest
- Geography
- latitude, longitude: 52.05314, 5.678333
- Site(s) history: plant grown in plantation managed, field wild
- Experimental or sampling design
- Design characteristics: Five dominant beech trees were randomly selected in a 97-year old - 30 m tall - beech forest stand. These trees were were harvested by sawing them at the stem base. In the same forest, ten small - 1-3 m tall - beech trees were cut at the stem base, and collected from a variety of light conditions.
- Variables included: status, a.lf, a.cp, h.t, h.c, d.cr, c.d, m.lf, a.ilf, ma.ilf, r.st
- Species sampled: Fagus sylvatica
- Research methods
- Leaf area: Leaf supporting apices were counted on harvested individuals. For the 5 adult trees, all leaves were counted attach on twigs belong to 25 apices, and leaf area was measured for a random sample of 30 leaves. For juveniles, all apices and leaves were counted, and leaf area was measured for all leaves (or a random sample of 30 leaves). From this, total leaf area was calculated per tree as the product of the mean leaf area, mean number of leaves per apex, and the total number of apici in the crown.
- Stem cross sectional area: These were calculated from two perpendicular diameter of stem cross section at the stem base, assuming the stem cross section has a circular shape.
- Height: Height was measured as the vertical distance from stem base to highest point in the crown. For tall trees, this distance was measured for the harvested tree using a centimeter. For juveniles, height was measured on standing trees.
- Crown area: Crown width was measured in two perpendicular directions on adults, using a Suunto clino meter . Crown area was calculated, assuming an ellipsoid crown form
- Biomass: The total leaf mass was calculated as the product of the number of apices, the average number of leaves on the twig of an apex, and the average leaf area
- Traits: On randoms samples of 30 leaves per trees, we collected the individual leaf area, leaf mass, and leaf mass per area. We determined the wood density for the adult trees from wood disks at the stem base.
- Other variables: We also calculated the allocation to wood (secondary growth), wood in new twig segments (primary growth), leaves and fruits. We therefore calculated the amount of biomass in the outer tree ring, based on wood disks taken at different height. We also measured the twig woody segment biomass and fruit biomass for a sample of 30 apices in tall trees, and of all apices in small trees. We could thus estimate the total biomass invested in wood, twig woody segment, leaves and fruits in the whole tree
- Study contacts: Frank Sterck
Sterck2001
Data from: Sterck FJ and Bongers F (2001). Crown development in tropical rain forest trees: patterns with tree height and light availability. Journal of Ecology, 89(1), pp. 1-13. DOI: 10.1046/j.1365-2745.2001.00525.x.
- Site Description
- Site(s) type(s): Tropical rainforest
- Geography
- latitude, longitude: 4.08, -52.66
- Site(s) history: plant grown in field wild
- Experimental or sampling design
- Design characteristics: In a natural tropical forest site, a 12-ha plot was mapped for trees with a stem diameter 3 10 cm at 1.30 m above ground level (d.b.h.), and a central 1.5-ha plot was mapped for trees with a stem diameter < 10 cm, but with a height greater than 0.50 m. For each species, we selected 20 of the inventoried individuals that were less than 4 m tall, ensuring that the full range of light levels within the site was represented. The crowns of taller individuals could only be studied from neighbouring trees (climbed using spikes or alpinist ropes). Because only a few of the inventoried individuals were accessible in this way, we included a selection of the accessible > 25 m trees (Vouacapoua, 25, 35 and 37 m, and Dicorynia, 26 and 37 m) from the adjacent area outside the plots.
- Variables included: light, a.lf, a.stbh, a.cp, h.t, h.c, d.bh, h.bh, d.cr, c.d, m.lf, a.ilf, ma.ilf
- Species sampled: Dicorynia guianensis Amshoff., Vouacapoua americana Aubl.
- Research methods
- Leaf area: Leaves were counted on all individuals, and for the bigger trees we did this by climbing carefully along the length of these individuals. Leaf area was determined (Delta Image Analysis System, Eijkelkamp 1991) as the mean value for 20 leaves taken from random positions in the crown. Total leaf area per trees was then calculated as the product of the number of leave and the average leaf area.
- Stem cross sectional area: The stem diameter at 1.3 was used to calculate the stem cross section area assuming a circular area.
- Height: Height was measured by keeping a centimeter from the top of the crown down to the ground, at equal height as the stem base.
- Crown area: Crown widths were measured in two perpendicular directions using a centimeter for small plant (up to 4 meters), and a Suunto clinometer for taller trees. Assuming a elliptoid crown surface area, we estimated the crown surface area.
- Biomass: Total leaf biomass was measured as the product of the total number of leaves and the average leaf dry weight.
- Traits: Leaf traits were sampled for a subsample of 20 leaves per tree.
- Other variables: Hemispherical photographs were made to estimate the light condition as the canopy openness percentrage per tree.
- Study contacts: Frank Sterck
Suzuki1990
Data from: Suzuki M, Tange T, Suzuki T and Suzuki S (1990). Growth and biomass of manmade Zelkova serrata stands in Tokyo University Forest in Chiba. Bulletin of the Tokyo University Forests, 82, pp. 113-129.
- Site Description
- Site(s) type(s): Temperate forest
- Geography
- latitude, longitude: 35.2, 140.1
- Site(s) history: plant grown in plantation managed
- Experimental or sampling design
- Design characteristics: Sampling was conducted in the University Forests in Chiba, the University of Tokyo (Suzuki et al. 1990). Twenty trees were felled in Zelkova serrata plantations at Koyanosawa (31 years old) on August 22-24, 1988 and at Ninosawa (65 years old) on August 30-31, 1988. The sample trees were cut at ground level then treated with the stratified clip technique by cutting them into parts contained in horizontal layers of 0-0.3 m, 0.3-1.3 m, at intervals of 2 m upward.
- Variables included: age, a.lf, a.stbh, h.t, d.bh, h.bh, m.lf, m.st, m.so, m.br
- Species sampled: Zelkova serrata
- Research methods
- Leaf area: Individual leaf areas of ca. 20 leaves were measured for each layer by an automatic planimeter (Planimex 25, Nireco) before oven-dried at 85 degree C and weighted (Suzuki et al. 1990). Total leaf area for each layer was estimated from the total dry mass of leaves and the obtained leaf area/leaf mass ratios.
- Stem cross sectional area: Estimated from stem diameter.
- Height: Measured by measuring tape after the trees were felled.
- Biomass: Fresh mass of stem, branches, and leaves in each layer were measured (Suzuki et al. 1990). Woody parts with diameter smaller than 7 cm were classified as branches. Measured fresh mass was converted to dry mass from the ratio of dry to fresh mass. To obtain the ratio of branch and leaves, subsamples were taken for each layer. For the ratio of stem, a disk was taken from each layer. Subsamples were weighted for fresh mass, oven-dried at 85 degree C, and weighted for dry mass.
- Other variables: Species name and family names were converted by M.I. Ishihara according to the following references: Satake Y, Hara H (1989a) Wild flower of Japan Woody plants I (in Japanese). Heibonsha, Tokyo; Satake Y, Hara H (1989b) Wild flower of Japan Woody plants II (in Japanese). Heibonsha, Tokyo.
- Study contacts: Takeshi Tange
Suzuki2012
Data from: Suzuki H (2012). Estimation of aboveground and belowground carbon stock in a forest of Northern Hokkaido. Masters thesis, Hokkaido University, Japan.
- Site Description
- Site(s) type(s): Temperate forest
- Geography
- latitude, longitude: 45.05, 142.12
- Site(s) history: plant grown in field wild
- Experimental or sampling design
- Design characteristics: The study was conducted in a natural deciduous broadleaf and evergreen conifer mixed forest at the Teshio Experimental Forest, Hokkaido University (Takagi et al. 2010). Forest floor was covered with dense dwarf bamboo. Canopy height was 20 m. A quadrate (15 times 15 m) was created (Suzuki 2012). Diameter at breast height and tree crown width were measured for all trees within the quadrate before the trees were felled. Roots of all trees were excavated at the soil depth of 0 to 70 cm. The soil on roots was completely washed away by spraying water with a compressor. Fine roots were not collected. Multiple-stemmed trees were excluded for this data paper.
- Variables included: a.stbh, h.t, d.bh, h.bh, m.lf, m.st, m.so, m.br, m.rt, m.to
- Species sampled: Abies sachalinensis, Acanthopanax sciadophylloides, Acer mono, Betula ermanii, Hydrangea paniculata, Picea glehnii, Picea jezoensis, Quercus crispula, Viburnum furcatum
- Research methods
- Stem cross sectional area: Estimated from stem diameter.
- Height: Measured after trees were cut down.
- Biomass: The fresh mass of each organ (trunk, branches, leaves, and roots) was weighed. For evergreen conifer species (Abies sachalinensis and Picea jezoensis), fresh mass of trunk, branches without leaves, branches with leaves, and roots was weighed. Measured fresh mass was converted to dry mass from the ratio of dry to fresh mass. The ratio was estimated from subsample taken from each tree and each organ. A disk of ca. 3 cm thick was taken from the base, middle, and near top heights of trunk for a sampled tree with the DBH > 0.1 m and the fresh mass was measured. For trees with the DBH < 0.1 m, one disk for each tree was obtained at the base of the trunk. Each disk was oven-dried at 70-80 degree C until there was no change in the mass, and the dry mass was measured. The trunk dry mass was then estimated by multiplying its fresh mass by the average dry to fresh mass ratio of the disk samples for each tree. For branches, coarse roots, leaves, (and branches with leaves for coniferous trees), one fresh subsample of > 2 kg (typically 3-6 kg) taken from several heights or depths for each tree was weighed when the total fresh mass of each organ was > 5 kg, while all the sample was used for the subsample when the total fresh mass was < 5 kg. The subsamples were oven-dried at 70-80 degree C until there was no change in the mass. The dry mass was estimated by multiplying the fresh mass by the dry to fresh mass ratio of the subsample for each organ for each tree.
- Other variables: Species name and family names were converted by M.I. Ishihara according to the following references: Satake Y, Hara H (1989a) Wild flower of Japan Woody plants I (in Japanese). Heibonsha, Tokyo; Satake Y, Hara H (1989b) Wild flower of Japan Woody plants II (in Japanese). Heibonsha, Tokyo.
- Study contacts: Kaichiro Sasa, Kentaro Takagi
Sweda2003
Data from: Sweda T and Shimokawa G (2003). Estimation of biomass of secondary deciduous broadleaved forest in the Experimental Forest of Ehime University. Estimation of bioproductivity and carbon fix ability on broadleaved secondary forests. Report of Grant-in-Aid for Scientific Research.
- Site Description
- Site(s) type(s): Temperate forest
- Geography
- latitude, longitude: 33.9, 132.9
- Site(s) history: plant grown in field wild
- Experimental or sampling design
- Design characteristics: Sampling was in a deciduous broadleaf secondary forest in the Komenono Forest Research Center of Ehime University, Japan. Trees were felled down and aboveground was separated into stem, branches, and leaves. Roots were excaveted or the soil on roots was washed away by spraying water.
- Variables included: a.stbh, h.t, d.bh, h.bh, m.lf, m.st, m.so, m.br, m.rt, m.to
- Species sampled: Acer mono, Carpinus spp., Fagus crenata, Swida controversa
- Research methods
- Stem cross sectional area: Estimated from stem diameter.
- Height: Not reported.
- Biomass: Measured fresh mass was converted to dry mass from the ratio of dry to fresh mass. The ratio was estimated from subsamples. Biomass of lost roots was estimated from the root diameter of the end point of the remaining root and the allometric equation W = a* d ^b where W was dry weight (g) of a root with basal root diameter of d (mm). This equation was obtained excavated root for each species. This estimation was used for lost root whose basal daimeter was >= 5 mm. Lost root biomass was only 2.8 % of the total root biomass in average.
- Other variables: M.I. Ishihara, H. Utsugi, H. Tanouchi, and T. Hiura conducted formal search of reference databases and digitized raw data from Sweda and Shimokawa (2003). Based on this reference, meta data was also created by M.I. Ishihara. Species name and family names were converted by M.I. Ishihara according to the following references: Satake Y, Hara H (1989a) Wild flower of Japan Woody plants I (in Japanese). Heibonsha, Tokyo; Satake Y, Hara H (1989b) Wild flower of Japan Woody plants II (in Japanese). Heibonsha, Tokyo.
- Study contacts: Masae I. Ishihara, Hajime Utsugi, Hiroyuki Tanouchi, Tsutom Hiura
Tadaki1979
Data from: Tadaki Y, Takeuchi I, Kawahara T, Sato A and Hatiya K (1979). Growth analysis on the natural stands of Japanese red pine (Pinus densiflora Sieb. et Zucc.) III. Results of experiment (Research note). Bulletin of the Forestry and Forest Products Research Institute, 305, pp. 125-144.
- Site Description
- Site(s) type(s): Temperate forest
- Geography
- latitude, longitude: 36.45, 140.11
- Site(s) history: plant grown in plantation managed, field wild
- Experimental or sampling design
- Design characteristics: Study was conducted in a naturally regenerated secondary Pine forest (Block III in the Takadateyama National Forest, compartment 91-Ka, Wo, and Wa, 200 m a.s.l.). For Block I see Ando 1962. The forest regenerated naturally during 1942-1947. Experimental plots were created in 1951. Plot A was thinned in 1961 to avoid strong competition (2100 trees / ha). Plot B was thinned in 1951 to the density of 10,000 trees / ha. Plot C was control without any thinning. The shape of a plot was 10 m times 10 m quadrate. Eight sample trees were selected from each plot to represent various diameter classes and felled in January 1976. Sample trees were treated with the stratified clip technique by cutting them into parts contained in horizontal layers of 1 m depth and separated into stem, branches, current-year branches, old needles, and new needles.
- Variables included: a.stbh, h.t, d.bh, h.bh, m.lf, m.st, m.so, m.br, m.rt, m.to
- Species sampled: Pinus densiflora
- Research methods
- Stem cross sectional area: Estimated from stem diameter.
- Height: Not reported.
- Biomass: Measured fresh mass was converted to dry mass from the ratio of dry to fresh mass. The ratio was estimated from subsamples.
- Other variables: M.I. Ishihara, H. Utsugi, H. Tanouchi, and T. Hiura conducted formal search of reference databases and digitized raw data from Tadaki et al. (1979). Based on this reference, meta data was also created by M.I. Ishihara. Species name and family names were converted by M.I. Ishihara according to the following references: Satake Y, Hara H (1989a) Wild flower of Japan Woody plants I (in Japanese). Heibonsha, Tokyo; Satake Y, Hara H (1989b) Wild flower of Japan Woody plants II (in Japanese). Heibonsha, Tokyo.
- Study contacts: Masae I. Ishihara, Hajime Utsugi, Hiroyuki Tanouchi, Tsutom Hiura
Tadaki1995
Data from: Tadaki Y (1995). Structure and productivity of young Castanopsis cuspidata forests growing in different stand densities. Bulletin of the Nagoya University Forest, 14, pp. 1-24.
- Site Description
- Site(s) type(s): Temperate forest
- Geography
- latitude, longitude: 32.82, 130.73
- Site(s) history: plant grown in field wild
- Experimental or sampling design
- Design characteristics: Sampled stands were located in the compartment 9-i of the Kyushu Research Center, Forestry and Forest Products Research Institute (FFPRI), Kumamoto, Japan. The stands regenerated from sprouts and seeds after clear cutting in 1940-1950s, located on the middle of the slope (ca. 80 m a.s.l.), and was pure stands of Castanopsis cuspidata with a few Quercus glauca. Sampling was conducted in four plots (plot 2, 4, 6, 8) in December 1967, and in adjacent stands in November 1961, December 1963, November 1965. Trees in the plots were thinned in the spring of 1961 to the density of 4125 trees/ha for plot 2, 7500 for plot 4, 32100 for plot 6 and 18400 for plot 8. In four plots, trees were selected to cover size ranges. In adjacent stands, all trees within a defined area (5 or 15 square meter) and several large trees outside the area were cut down. After felling tree, tree height, height of the lowest living branch, and stem diameters at breast height were measured. Sample trees were then treated with the stratified clip technique by cutting them into parts contained in horizontal layers of 1 m depth and separated into stem, branches, and leaves. Roots were excavated. We only included data of single-stem trees for this data paper.
- Variables included: age, a.lf, a.stbh, h.t, d.bh, h.bh, m.lf, m.st, m.so, m.br, m.rt, m.to
- Species sampled: Castanopsis cuspidata
- Research methods
- Leaf area: Total leaf area was estimated from fresh mass of leaves and leaf area/leaf mass ratios obtained from subsamples. For sampled trees from adjacent stands, average leaf area/leaf mass ratios was used for each sampling. For sampled trees from plots 2, 4, 6, and 8, leaf area/leaf mass ratios of each layer was used. Leaf area was measured by the dot-counting method proposed by Negishi et al. (1957, J. Jp. For. Soc. 39: 380-384) (Tadaki et al. 1962, J. Jp. For. Soc. 44: 350-359). Transpalent plate with marked dots at a certain interval such as every 1 cm was placed randomly on a leaf. Leaf area was estimated from the relationship between leaf area and the counted number of dots in the leaf.
- Stem cross sectional area: Estimated from stem diameter.
- Height: Measured after trees were felled.
- Biomass: Measured fresh mass of each component was converted to dry mass from the ratio of dry to fresh mass. The ratio was estimated from a subsample taken for a componet at each sampling which were oven-dried at 80 degC (Tadaki 1968, J. Jp. For. Soc. 50: 60-65). Same ratio was used for trees sampled in the same year.
- Other variables: M.I. Ishihara, H. Utsugi, H. Tanouchi, and T. Hiura conducted formal search of reference databases and digitized raw data from Tadaki (1995). Based on this reference and Tadaki (1962) and Tadaki et al. (1968), meta data was also created by M.I. Ishihara. Species name and family names were converted by M.I. Ishihara according to the following references: Satake Y, Hara H (1989a) Wild flower of Japan Woody plants I (in Japanese). Heibonsha, Tokyo; Satake Y, Hara H (1989b) Wild flower of Japan Woody plants II (in Japanese). Heibonsha, Tokyo.
- Study contacts: Masae I. Ishihara, Hajime Utsugi, Hiroyuki Tanouchi, Tsutom Hiura
Takagi2010
Data from: Takagi K, Kotsuka C, Fukuzawa K, Kayama M, Makoto K, Watanabe T, Nomura M, Fukazawa T, Takahashi H, Hojyo H, Ashiya D, Naniwa A, Sugata S, Kamiura T, Sugishita Y, Sakai R, Ito K, Kobayashi M, Maebayashi M, Mizuno M, Murayama T, Kinoshita K, Fujiwara D, Hashida S, Shibata H, Yoshida T, Sasa K, Saigusa N, Fujinuma Y and Akibayashi Y (2010). Allometric relationships and carbon and nitrogen contents for three major tree species (Quercus crispula, Betula ermanii, and Abies sachalinensis) in Northern Hokkaido, Japan. Eurasian Journal of Forest Research, 13, pp. 1-7.
- Site Description
- Site(s) type(s): Temperate forest
- Geography
- latitude, longitude: 45.05, 142.12
- Site(s) history: plant grown in field wild
- Experimental or sampling design
- Design characteristics: The study was conducted in natural forests at the Teshio Experimental Forest, Hokkaido University (Takagi et al. 2010). Seven or eight trees per species were selected to cover wide range of diameter at breast height (DBH) in late August of 2001 through 2007.
- Variables included: a.stbh, a.cp, h.t, d.bh, h.bh, d.cr, m.lf, m.st, m.so, m.br, m.rc, m.to
- Species sampled: Abies sachalinensis, Betula ermanii, Quercus crispula
- Research methods
- Stem cross sectional area: Estimated from stem diameter.
- Height: The trunk top heights were measured after cutting the trees (Takagi et al. 2010).
- Crown area: The crown widths for the two directions (north to south, east to west) were measured before cutting each tree (Takagi et al. 2010).
- Biomass: The fresh mass of each organ (trunk, branches, and leaves) was weighed at 2-m height intervals along the trunk of each sampled tree (Takagi et al. 2010). The trunk was defined as the part that directly connects with roots and reaches the top of the tree, and the remaining woody aboveground parts were categorized as branches. The heights of branches and leaves were categorized based on the actual position in the stand, not by the height connecting with the trunk. Branches were divided into three categories based on diameter (<2 cm, 2-5 cm, and >5 cm), and the fresh mass was measured for each category at 2-m height intervals. For Betula and Quercus, all leaves were separated from the trunks and branches and the fresh mass was measured. For Abies, all leaves were separated from the trunk and branches when these woody parts were more than 2 cm in diameter. For those branches less than 2 cm in diameter, subsample of the branches with leaves (>1.5 kg fresh mass) was separated into leaves and branches at 2-m height intervals, and the leaf/branch dry mass ratio was applied to all the branches with leaves to estimate each leaf and branch dry mass for each height. For an Abies tree with a 50.16-cm DBH, the leaf/branch dry mass ratio ranged 0.430-0.468, and the average and standard deviation of the 10 height categories (21.35 m in the tree height) were 0.446 and 0.011, respectively. Even if we assume that the deviation in the ratio among the height categories was caused only by the sampling error, this leaf dry mass estimation procedure causes < +/- 2% error (or +/- 1.9 of 117 kg dry leaf mass) for this tree. Stumps with roots were pulled out using a backhoe, and the remaining roots were dug up manually using shovels. The soil on roots was completely washed away by spraying river water on site with a compressor and using brushes. Roots were split into four categories based on diameter (< 2 cm, 2-5 cm, 5-10 cm, and >10 cm), and the fresh mass was measured for each category. Fine roots (< ca.0.5 cm in diameter) were not collected. A disk of ca. 3 cm thick was taken from each 2-m interval of trunk of a sampled tree, and the fresh mass was measured. Each disk was oven-dried at 70-80°C until there was no change in the mass (typically it took 1 month), and the dry mass was measured. The trunk dry mass was then estimated at each 2-m interval by multiplying its fresh mass by the dry/fresh mass ratio of the disk sample. For branches, coarse roots, and leaves, typically 1-3 kg of the fresh subsample was weighed for each 2-m height interval and each branch and coarse-root diameter class and oven-dried at 70-80°C until there was no change in the mass. The dry mass was estimated by multiplying the fresh mass by the dry/fresh mass ratio of the sample for each diameter (branches and coarse roots) and height classes.
- Other variables: Species name and family names were converted by M.I. Ishihara according to the following references: Satake Y, Hara H (1989a) Wild flower of Japan Woody plants I (in Japanese). Heibonsha, Tokyo; Satake Y, Hara H (1989b) Wild flower of Japan Woody plants II (in Japanese). Heibonsha, Tokyo.
- Study contacts: Kentaro Takagi
Takahashi1999
Data from: .Takahashi K, Yoshida K, Suzuki M, Seino T, Tani T, Tashiro N, Ishii T, Sugata S, Fujito E, Naniwa A, Kudo G, Hiura T and Kohyama T (1999). Stand biomass, net production and canopy structure in a secondary deciduous broad-leaved forest, northern Japan. Research bulletin of the Hokkaido University Forests, 56, pp. 70-85.
- Site Description
- Site(s) type(s): Temperate forest
- Geography
- latitude, longitude: 42.7, 141.6
- Site(s) history: plant grown in field wild
- Experimental or sampling design
- Design characteristics: Sample trees were felled in a secondary deciduous broadleved forest (ca. 90 m a.s.l.) in Tomakomai Experimental Forest of Hokkaido University, Hokkaido, in September 1997. All trees > 3.0 cm in diameter at breast height on the 10 m x 10 m plot were cut at ground level. Tree height, height of the lowest living branch, and stem diameters at breast height were measured. Stem of each sample tree was cut at 1-m intervals and fresh mass of each segment was measured. Fresh mass of brach and those of leaves were measured for each branch. Roots were excavated using a backhoe. Soil was completely washed away by spraying river water with a compressor. Fresh mass of stump and roots was measured.
- Variables included: age, a.lf, a.stbh, a.stbc, a.cp, h.t, h.c, d.bh, h.bh, d.cr, c.d, m.lf, m.st, m.so, m.br, m.rt, m.to
- Species sampled: Acer mono, Carpinus cordata, Fraxinus mandshurica, Magnolia obovata, Magnolia praecocissima, Phellodendron amurense, Prunus maximowiczii, Prunus ssiori, Quercus crispula, Sorbus alnifolia
- Research methods
- Leaf area: Several leaves were taken from each branch of each tree, and were separated into leaf blades and petioles. Leaf area was measured with a digital image processor. The dry masses of the leaf blades and petioles were weighed after oven-drying at 80degC for at least 2 days. The total leaf area was obtained by multiplying the estimated dry mass of leaves by its SLA and the ratio of leaf blades to leaves.
- Stem cross sectional area: Estimated from stem diameter.
- Height: Measured by measuring tape after felling the trees.
- Crown area: Crown projection area was measured.
- Biomass: Measured fresh weight was converted to dry weight from the ratio of dry to fresh weights. The ratio was estimated from subsamples. For stem subsample, a disc of ca. 10 cm thick was taken from each 1-m trunk segment, and for branch and root subsample, several discs with ca. 15-20 cm thick were taken from each branch or root at arbitrarily selected point. The mean ratio was used for each branch. Discs were oven-dried for a week at lOO degC and the dry mass was measured. For leaf subsample, several leaves were taken from each branch of each tree, and dry mass were weighed after oven-drying at 80 degC for at least 2 days.
- Other variables: M.I. Ishihara, H. Utsugi, H. Tanouchi, and T. Hiura conducted formal search of reference databases and digitized raw data from Takahashi et al. (1999). Based on this reference, meta data was also created by M.I. Ishihara. Species name and family names were converted by M.I. Ishihara according to the following references: Satake Y, Hara H (1989a) Wild flower of Japan Woody plants I (in Japanese). Heibonsha, Tokyo; Satake Y, Hara H (1989b) Wild flower of Japan Woody plants II (in Japanese). Heibonsha, Tokyo.
- Study contacts: Masae I. Ishihara, Hajime Utsugi, Hiroyuki Tanouchi, Tsutom Hiura
Tanao1982
Data from: Tanao T (1982). Biomass and its increment in a hinoki plantation. Masters thesis, Faculty of Agriculture, Nagoya University, Japan.
- Site Description
- Site(s) type(s): Temperate forest
- Geography
- latitude, longitude: 35.2, 137.57
- Site(s) history: plant grown in plantation managed
- Experimental or sampling design
- Design characteristics: The allometric relationships between different dimensions of a hinoki (Chamaecyparis obtusa (Sieb. Et Zucc.) Endl.) tree were examined on the basis of 55 destructive samples, which were collected from four different stands and whose age ranged from 12 to 59 years (Hagihara1993). Only 5 sample trees are reported here. For the rest of 50 trees see Hagihara1993, Iijima1991, Mori1991, Nakagaki1983, and Yamaji1991. Biomass and leaf area estimates were determined by the stratified clip technique, in which the stratum was 0.0-0.3 m, 0.3-1.3 m, 1.3-2.3 m, and at intervals of 1 m upward.
- Variables included: age, a.lf, a.stbh, a.stbc, h.t, h.c, d.bh, h.bh, c.d, m.lf, m.st, m.so, m.br, m.rt, m.to
- Species sampled: Chamaecyparis obtusa
- Research methods
- Leaf area: Leaf area was determined with area meters (Murayama NCE-3, Hayashi AAC-100, Hayashi AAM-5) on subsamles and was then extrapolatied to total leaf area using specific leaf area from each stratum and summing up each stratum. Specific leaf area was estimated from a sample of leaves used for estimating the ratio of dry/fresh weight and area. Total leaf weight was measured for each stratum.
- Stem cross sectional area: Estimated from stem diameter.
- Height: Height was measured as the vertical distance from the ground surface to the highest apex of each tree.
- Biomass: Trees were separated into roots, stems, branches and leaves, and then weighed. Sub-samples of the total fresh weight were taken and dried in ventilated ovens at 85 degC for a few days for fresh mass/dry mass estimates. The fresh biomass was converted into dry biomass estimates of roots, stem, branches and leaves per tree using the respective dry/fresh mass ratios.
- Study contacts: Akio Hagihara
Tange1995
Data from: Tange T (1995). Ecophysiological study on the growth of Cryptomeria japonica planted trees. Bulletin of the Tokyo University Forests, 93, pp. 65-145.
- Site Description
- Site(s) type(s): Temperate forest
- Geography
- latitude, longitude: 35.2, 140.1
- Site(s) history: plant grown in plantation managed
- Experimental or sampling design
- Design characteristics: Sampling was conducted in the University Forests in Chiba, the University of Tokyo (Tange 1995). Twenty-five trees were felled in old-growth Cryptomeria japonica plantations at Gobozawa (plots GBU1, GBU2, GBM, and GBL, geology: Mane mudstone member) in November 1988 and at Imasumi (plot IML, geology: Kiwada mudstone member) in November 1985. Plots GBU1 and GBU2 were located near the ridge, plot GBM on a middle part of a slope, and plot GBL and IML near the bottom of slopes. Altitude, slope, slope direction, stand age, mean stem diameter, and mean tree height were: GBU1: 270 m, 36 degree, W, 83 years, 28.9 cm, 17.3 m; GBU2: 200 m, 3 degree, W, 83 years, 27.0 cm, 19.8 m; GBM: 205 m, 20 degree, W, 86 years, 39.7 cm, 25.5 m; GBL: 180 m, 5 degree, NW, 83 years, 47.6 cm, 35.2 m; IML: 300 m, 18 degree, E, 122 years, 50.5 cm, 27.6 m. Five trees were cut at ground level from each plot to cover tree size ranges. The sample trees were then treated with the stratified clip technique by cutting them into parts contained in horizontal layers of 0-0.3 m, 0.3-1.3 m, at intervals of 2 m upward in Imasumi. In Gobozawa, horizontal layers were 0-0.3 m, 0.3-1.3 m, at intervals of 4 m up to crown base, and at intervals of 2 m further upward. In addition, 12 trees were felled in young Cryptomeria japonica plantations at Maruyama (plots MR(B)U and MR(B)L, geology: Shiraiwa tuff member, stand age: 2), Ninosawa (plots NNU and NNL, geology: Mane mudstone member, stand age: 4), and at Maezawa (plots ME(C)U and ME(C)L, geology: Kiwada mudstone member, stand age: 4) in January 1986. Plots with U in their names were located near the ridge, and those with L were near the bottom of slopes. Mean stem diameter and mean tree height were: MR(B)U: 2.4 cm, 1.18 m; MR(B)L: 2.7 cm, 1.53 m; NNU: 2.5 cm, 1.15 m; NNL: 4.1 cm, 2.20 m; ME(C)U: 2.9 cm, 1.38 m; ME(C)L: 5.1 cm, 2.40 m. Two trees of average size were sampled from each plot. The sample trees were then treated with the stratified clip technique by cutting them into three parts. Roots including fine roots of the sampled trees from were excavated carefully.
- Variables included: age, a.stba, a.stbh, h.t, d.ba, d.bh, h.bh, m.lf, m.st, m.so, m.br, m.rt, m.to
- Species sampled: Cryptomeria japonica
- Research methods
- Stem cross sectional area: Estimated from stem diameter.
- Height: Measured by measuring tape after sampled trees were cut down.
- Biomass: Sample trees in old-growth plantations were divided into each layer and each organs (stem, branches, and leaves) and weighted (Tange 1995). Green branches with diameter > 5 mm were categorized as branches and those =< 5 mm as leaves. Fresh mass of stem, branches, and leaves was converted to dry mass from the ratio of dry to fresh mass. The ratio was estimated from subsamples taken from each tree. For stem, a disk of ca. 5 cm thickness was collected as subsample at the basal end of each horizontal layer. For leaves and branches, subsample was collected from each layer. Various sized branches were included in subsample. Subsamples were weighted for fresh mass, oven-dried at 85 degree C, and weighted for dry mass. Each of three parts of young sample trees were divided into each organs (stem, branches, leaves, and roots), oven-dried, and weighted.
- Other variables: Species name and family names were converted by M.I. Ishihara according to the following references: Satake Y, Hara H (1989a) Wild flower of Japan Woody plants I (in Japanese). Heibonsha, Tokyo; Satake Y, Hara H (1989b) Wild flower of Japan Woody plants II (in Japanese). Heibonsha, Tokyo.
- Study contacts: Takeshi Tange
Tange2010
Data from: Tange T and Kojima K (2010). Aboveground biomass data of Anno growth monitoring stands of Cryptomeria japonica in the University Forest in Chiba, The University of Tokyo. Technical Report 49, Miscellaneous information, the Tokyo University Forests.
- Site Description
- Site(s) type(s): Temperate forest
- Geography
- latitude, longitude: 35.2, 140.1
- Site(s) history: plant grown in plantation managed
- Experimental or sampling design
- Design characteristics: Sampling was conducted in two 91-year old Cryptomeria japonica plantations (Anno1 and Anno2 in sub-compartment C5, compartment 2) located on almost flat fluvial terrace in the University Forests in Chiba, the University of Tokyo (Tange and Kojima 2010). No thinning was conducted in the past 40 years. Tree density was 1230 and 1120 trees per hector for Anno1 and Anno2, respectively. Mean stem diameter at breast height and mean tree height were 27 cm and 19 m for Anno1, and 31 cm and 23 m for Anno2. Three trees from Anno1 and four from Anno2 were selected including dominant, average, and suppressed trees. Sample trees were cut at ground level in April 1993. Sample trees were then treated with the stratified clip technique by cutting them into parts contained in horizontal layers of 0-0.3 m, 0.3-1.3 m, and at intervals of 2 m upward.
- Variables included: age, a.stbh, h.t, h.c, d.bh, h.bh, c.d, m.lf, m.st, m.so, m.br
- Species sampled: Cryptomeria japonica
- Research methods
- Stem cross sectional area: Estimated from stem diameter.
- Height: Measured by measuring tape after the trees were felled.
- Biomass: Fresh mass of leaves, branches, and stem were measured separately for each layer and tree (Tange and Kojima 2010). Green branches with diameter > 5 mm were categorized as branches and those =< 5 mm as leaves. Subsamples were collected for each component, each layer, and each tree and were oven-dried at 80 degree C. For stem subsample, a disk of 3-5 cm thickness was collected from the lower end of each stem segment. The dry-to-fresh mass ratios of these subsamples were used to calculate total dry mass of each tree component from fresh mass.
- Other variables: Species name and family names were converted by M.I. Ishihara according to the following references: Satake Y, Hara H (1989a) Wild flower of Japan Woody plants I (in Japanese). Heibonsha, Tokyo; Satake Y, Hara H (1989b) Wild flower of Japan Woody plants II (in Japanese). Heibonsha, Tokyo.
- Study contacts: Takeshi Tange
Terashi1982
Data from: Terashi K and Setoguchi T (1982). Studies on subtropical broadleaf forest (III) Biomass of Castanopsis sieboldii. The Bulletin of Kyushu Branch of the Japanese Forestry Society, 35, pp. 91-92.
- Site Description
- Site(s) type(s): Temperate forest
- Geography
- latitude, longitude: 28.33, 129.45; 28.3, 129.3
- Site(s) history: plant grown in field wild
- Experimental or sampling design
- Design characteristics: Ten trees were felled in each of two Castanopsis sieboldii secondary forests in Amami-oshima, Japan in December 1980. Stand A regenerated after clear cutting before 1945 and assumed to be 45 years old (300 m a.s.l., south-east facing slope). Stand B regenerated from sprouts after clear cutting in 1964 and assumed to be 16 years old (ca. 200 m a.s.l., south-east facing gentle slope). Trees were selected to cover size ranges. Sample trees were then treated with the stratified clip technique by cutting them into parts contained in horizontal layers and components (stem, branches, and leaves).
- Variables included: a.lf, a.stbh, h.t, h.c, d.bh, h.bh, c.d, m.lf, m.st, m.so, m.br
- Species sampled: Castanopsis sieboldii
- Research methods
- Leaf area: Leaf area was probably estimated from leaf mass and the ratio of leaf area to mass. Leaf area was measured by automatic leaf area meter.
- Stem cross sectional area: Estimated from stem diameter.
- Height: Method not reported.
- Biomass: Measured fresh mass was converted to dry mass from the ratio of dry to fresh mass. The ratio was estimated from subsamples.
- Other variables: M.I. Ishihara, H. Utsugi, H. Tanouchi, and T. Hiura conducted formal search of reference databases and digitized raw data from Terashi and Setoguchi (1982). Based on this reference, meta data was also created by M.I. Ishihara. Species name and family names were converted by M.I. Ishihara according to the following references: Satake Y, Hara H (1989a) Wild flower of Japan Woody plants I (in Japanese). Heibonsha, Tokyo; Satake Y, Hara H (1989b) Wild flower of Japan Woody plants II (in Japanese). Heibonsha, Tokyo.
- Study contacts: Masae I. Ishihara, Hajime Utsugi, Hiroyuki Tanouchi, Tsutom Hiura
Tissue0000a
Data from: Tissue D (Unpublished).
- Site Description
- Site(s) type(s):
- Geography
- latitude, longitude: -33.61, 150.75
- Site(s) history: plant grown in glasshouse
- Experimental or sampling design
- Design characteristics: Eucalyptus sideroxylon seedlings were grown under a treatment combination of ambient or elevated temperature (26/18C or 30/22C) and subambient, ambient or elevated CO2 (280, 400 or 640 ?L L-1). Seedlings were grown at full field capacity for 9 months, after which a drought treatment was applied to one half of the seedlings for approximately 3 months. Seedlings were grown from 265-290 days from planting, at which time they were subjected to a destructive harvest of all biomass.
- Variables included: a.lf, m.lf, m.st, m.so, m.rt, m.to
- Species sampled: Eucalyptus sideroxylon
- Research methods
- Leaf area: All leaves were measured in a leaf area meter (LI-COR 3100, LI-COR, Inc., Lincoln, Nebr.).
- Height: Height was measured as the vertical distance from the pot surface to the highest apex.
- Biomass: Stems, leaves and roots were destructively harvested on multiple days (78, 79, 80, 83 and 85 days) after planting, and dried for 1 week at 70degreesC.
- Study contacts: David Tissue
Tissue0000b
Data from: Tissue D (Unpublished).
- Site Description
- Site(s) type(s):
- Geography
- latitude, longitude: -33.61, 150.75
- Site(s) history: plant grown in glasshouse
- Experimental or sampling design
- Design characteristics: Eighty cotton (Gossypium hirsutum L.) plants were grown for 38 days under a treatment combination of ambient or elevated temperature (28/17?C or 32/21?C) and ambient (400 ?L L-1) or elevated [CO2] (640 ?L L-1). Throughout treatments, plants were watered to full field capacity.
- Variables included: a.lf, h.t, m.lf, m.st, m.so, m.rt, m.to
- Species sampled: Gossypium hirsutum
- Research methods
- Leaf area: All leaves were placed in a leaf area meter.
- Height: Height was measured as the vertical distance from the pot surface to the highest apex.
- Biomass: All stems, leaves and roots were destructively harvested 38 days after planting, and dried for 1 week at 70degreesC.
- Study contacts: David Tissue
Tissue0000c
Data from: Tissue D (Unpublished).
- Site Description
- Site(s) type(s):
- Geography
- latitude, longitude: -33.61, 150.75
- Site(s) history: plant grown in glasshouse
- Experimental or sampling design
- Design characteristics: One year old seedlings of Wollemi Pine were grown in a glasshouse at the University of Western Sydney for 17 months under 50% shadecloth. Treatments imposed on the seedlings included a combination of temperature (26 or 31 degrees C) and CO2 (200, 400 or 640 ppm). Treatments were continued for 17 months at which time a destructive harvest took place for 6 replicates from each temperature and CO2 combination.
- Variables included: age, a.lf, m.lf, m.st, m.so, ma.ilf, n.lf
- Species sampled: Wollemia nobilis
- Research methods
- Leaf area: All leaves were measured in a leaf area meter (LI-COR 3100, LI-COR, Inc., Lincoln, Nebr.).
- Height: Height was measured as the vertical distance from the pot surface to the highest apex.
- Biomass: All stems, leaves and roots were destructively harvested 80 days after planting, and dried for 1 week at 70degreesC.
- Other variables: Seedlings were grown under 50% shade cloth.
- Study contacts: David Tissue
Utsugi0000
Data from: Utsugi H and Tanouchi H (Unpublished).
- Site Description
- Site(s) type(s): Temperate forest
- Geography
- latitude, longitude: 42.75, 141.52
- Site(s) history: plant grown in plantation managed
- Experimental or sampling design
- Design characteristics: 10 Larix kaempferi trees were cut at ground level. Stem diameter and tree height were measured. Sample trees were then treated with the stratified clip technique by cutting them into parts contained in horizontal layers of 2 m thickness.
- Variables included: a.stbh, h.t, d.bh, h.bh, m.lf, m.st, m.so, m.br
- Species sampled: Larix kaempferi
- Research methods
- Stem cross sectional area: Estimated from stem diameter.
- Height: Measured by measuring tape.
- Biomass: Fresh weights of leaves, branches and stem were measured separately for each layer and tree. Subsamples of each organ (stem discs, branches, and 10-100 g of fresh leaves) were taken from each layer and oven-dried at 70 degC for 2 days for leaves and for 7 days for branches and stem subsamples. The dry-to-fresh weight ratios of the subsample was used to calculate dry weight of each tree component for each layer.
- Study contacts: Hajime Utsugi, Hiroyuki Tanouchi
Utsugi2004
Data from: Utsugi H, Abe S, Iida S, Tobita H, Tanouchi H and Sato M (2004). The above ground biomass components of boreal deciduous forest in Northen Japan 1: The above ground biomass estimation and vertical distribution of foliage area. The Bulletin of Hokkaido Branch of the Japanese Forestry Society, 52, pp. 99-101.
- Site Description
- Site(s) type(s): Temperate forest
- Geography
- latitude, longitude: 42.9887, 141.385
- Site(s) history: plant grown in field wild
- Experimental or sampling design
- Design characteristics: 10 Quercus crispula, 8 Kalopanax septemlobus, and 8 Betula platyphylla trees located near a permanent plot were cut at ground level. Stem diameter and tree height were measured. Sample trees were then treated with the stratified clip technique by cutting them into parts contained in horizontal layers of 1 m thickness.
- Variables included: a.stbh, h.t, h.c, d.bh, h.bh, c.d, m.lf, m.st, m.so, m.br
- Species sampled: Betula platyphylla, Kalopanax pictus, Quercus crispula
- Research methods
- Leaf area: Possible to provide leaf area data with request.
- Stem cross sectional area: Estimated from stem diameter.
- Height: Measured by measuring tape.
- Crown area: Possible to provide crown area data with request.
- Biomass: Fresh weights of leaves, branches and stem were measured separately for each layer and tree. Subsamples of each organ (stem discs, branches, and 10-100 g of fresh leaves) were taken from each layer and oven-dried at 70 degC for 2 days for leaves and for 7 days for branches and stem subsamples. The dry-to-fresh weight ratios of the subsample was used to calculate dry weight of each tree component for each layer.
- Other variables: Species name and family names according to the following references: Satake Y, Hara H (1989a) Wild flower of Japan Woody plants I (in Japanese). Heibonsha, Tokyo; Satake Y, Hara H (1989b) Wild flower of Japan Woody plants II (in Japanese). Heibonsha, Tokyo.
- Study contacts: Hajime Utsugi, Hiroyuki Tanouchi
Valladares2000
Data from: Valladares F, Wright SJ, Lasso E, Kitajima K and Pearcy R (2000). Plastic phenotypic response to light of 16 congeneric shrubs from a Panamanian rainforest. ECOLOGY, 81(7), pp. 1925-1936. DOI: 10.1890/0012-9658(2000)081[1925:PPRTLO]2.0.CO;2.
- Site Description
- Site(s) type(s): Tropical rainforest
- Geography
- latitude, longitude: 9.15, -79.85
- Site(s) history: plant grown in common garden
- Experimental or sampling design
- Design characteristics: Three individuals of each species were harvested from each light treatment.
- Variables included: a.lf, a.cp, a.cs, h.t, h.c, d.cr, c.d, m.lf, m.to, a.ilf, ma.ilf, r.st
- Species sampled: Psychotria acuminata, Psychotria brachiata, Psychotria chagrensis, Psychotria emetica, Psychotria gracilifora, Psychotria grandis, Psychotria horizontalis, Psychotria ipecacuan, Psychotria limonensis, Psychotria marginata, Psychotria micrantha, Psychotria pittieri, Psychotria psychotriifolia, Psychotria pubescens, Psychotria racemosa
- Research methods
- Leaf area: Leaf area was measured with a portable LI-COR Model 3000 area meter (LI-COR, Lincoln, Nebraska, USA) before drying.
- Height: Length and diameter of all stems, branches, and petioles, and the surface area of all leaves were measured as soon as the plants had two to three fully developed leaves.
- Biomass: Leaves, petioles, stems, branches, and roots of each plant were dried to a constant mass at 70oC. The aboveground biomass of each plant was then calculated from allometric relationships obtained in parallel, destructive measurements carried out in replicate seedlings. The process was repeated on the very same plants each month for fast-growing plants and every two months for slow-growing plants in order to calculate the aboveground biomass increase as a function of time.
- Other variables: Seven variables were considered: leaf mass per unit area, leaf area ratio (total leaf surface area per whole plant mass, m2/kg), supporting biomass (percentage of aboveground plant mass represented by petioles, branches, and stems), root:shoot ratio (root mass per shoot mass, g/g), photosynthetic capacity (Amax, mmol CO2/m2/s2), dark respiration (mmol O2/m2/s2), and aboveground relative growth rate (RGR, mg/g2/wk2).
- Year collected: 1997
- Study contacts: Fernando Valladares
vanBreugel2011
Data from: Breugel Mv, Ransijn J, Craven D, Bongers F and Hall JS (2011). Estimating carbon stock in secondary forests: Decisions and uncertainties associated with allometric biomass models. Forest Ecology and Management, 262(8), pp. 1648-1657. DOI: 10.1016/j.foreco.2011.07.018.
- Site Description
- Site(s) type(s): Tropical seasonal forest
- Geography
- latitude, longitude: 9.217, -79.783
- Site(s) history: plant grown in field wild
- Experimental or sampling design
- Design characteristics: Out of >350 tree and shrub species that were occur across secondary forest in STRIs Agua Salud area, 26 of the most abundant species in terms of basal area were selected for destructive sampling . A total of 236 saplings of various sizes (basal diameter range: 0.85-29 cm) were sampled to determine dry weight of leaves, branches and stems and allometric relationships. Saplings grew under a range of canopy conditions; from understory conditions to fully exposed crowns, and were selected in areas adjacent to Agua Saluds Secondary Forest Dynamics Study plots .
- Variables included: a.stba, a.stbh, a.cp, h.t, h.c, d.ba, d.bh, h.bh, d.cr, c.d, m.lf, m.st, m.so, m.br
- Species sampled: Annona spraguei, Apeiba tibourbou, Banara guianensis, Byrsonima crassifolia, Casearia sylvestris, Cochlospermum vitifolium, Conostegia xalapensis, Cordia bicolor, Cupania cinerea, Cupania scrobiculata, Inga cocleensis, Inga thibaudiana, Lacistema aggregatum, Miconia affinis, Miconia argentea, Pachira sessilis, Ryania speciosa, Schefflera morototoni, Terminalia amazonia, Thevetia ahouai, Trema micrantha, Trichospermum galeottii, Vernonanthura patens, Vismia baccifera, Vismia macrophylla, Xylopia frutescens
- Research methods
- Height: Tree height was measured as stem length, measured linearly from base to top after felling.
- Crown area: Crown width was measured at two perpendicular angles including the widest width. Projected area and volume were estimated by assuming an ellipse/ellipsoid.
- Biomass: Saplings were divided into stem, branches (grouped in three size classes), petioles and leaves. All compartments were weighed directly after harvest. Subsamples for each compartment were oven-dried at 70degC to constant weight and weighed to calculate fresh to dry weight ratios (for small saplings all biomass was dried). Fresh to dry weight ratios were used to calculate dry weights for each compartment. Given leaf weights include petioles and leaves.
- Year collected: 2009
- Study contacts: Michiel van Breugel, Johannes Ransijn, Jefferson S. Hall
Vanninen2005
Data from: Vanninen P and Mäkelä A (2005). Carbon budget for Scots pine trees: effects of size, competition and site fertility on growth allocation and production. Tree Physiology, 25(1), pp. 17-30. DOI: 10.1093/treephys/25.1.17.
- Site Description
- Site(s) type(s): Boreal forest
- Geography
- latitude, longitude: 62.05, 24.817; 62.067, 23.85; 60.367, 25.017; 61.8, 24.317; 61.283, 27; 61.333, 25
- Site(s) history: plant grown in plantation managed
- Experimental or sampling design
- Design characteristics: The sample trees represent a collection from several studies: Vanninen et al. 1996, Mäkelä and Vanninen 1998, Vanninen and Mäkelä (1999,2000,2005). In all studies the sample trees were selected randomly from the composed stem frequency series of each plot. The selection was further targeted so that sampling targeted to trees representing dominant, intermediate and suppressed trees.
- Variables included: age, a.lf, a.stbh, h.t, h.c, d.bh, h.bh, c.d, m.lf, m.ss, m.sh, m.st, m.so, m.br, m.rf, m.rc, m.rt, m.to
- Species sampled: Pinus sylvestris
- Research methods
- Stem cross sectional area: Was determined as an average of four stem radii under bark, measured from sample disks in four cardinal points at minimum accuracy of 1 mm.
- Height: Was tape-measured on felled trees.
- Leaf mass: Leaf mass is based on sample branches taken systematically in the crowns of all trees. A regression model was developed and parametrised separately for subsets of trees, predicting the leaf biomass of each branch from branch diameter and distance from the top.
- Branch mass: Branch mass was estimated using the same method as for leaf mass.
- Stem sapwood mass: Disks were taken at several heights of the stem, always including breast height and crown base. Sapwood and heartwood rings were estimated by viewing the disks against light. The cross-sectional area of the disks (both sapwood and heartwood components) was estimated as a circular plate with a diameter that was the average of two measured perpendicular diameters. The volume of the stem sections between the consecutive disks was calculated as cut cones, and the biomass was obtained using the density of the lower disk, measured by weighing the dry weight and immersion.
- Stem heartwood mass: See stem sapwood mass.
- Fine root mass: Stand-level estimate of fine root (< 2mm) mass was obtained from soil core samples. Individual-tree fine root estimates were based on dividing the stand level estimate in proportion to basal area.
- Coarse root mass: For coarse root mass, all roots were dug up in a 90 degree sector chosen at random around the tree. Roots were followed up to 0.5 cm thickness. They were cleaned and oven dried.
- Foliage area: Specific leaf area was measured from a subsample of foliage to convert foliage mass to foliage area.
- Crown length: Crown length was measured from felled trees using a tape measure. Crown base was defined as the height where at least two consecutive dead whorls could be found below the continuous crown.
- Crown area: Crown width was measured across the widest diameter and perpendicular to that. The length of the crown above and below its widest point were recorded and crown area was estimated as the area of the two cones defined by crown width and the upper and lower lengths.
- Year collected: 1992, 1994-1997
- Study contacts: Petteri Vanninen, Annikki Mäkelä
Wang1995
Data from: Wang J, Zhong A, Comeau P, Tsze M and Kimmins J (1995). Aboveground biomass and nutrient accumulation in an age sequence of aspen (Populus tremuloides) stands in the Boreal White and Black Spruce Zone, British Columbia. Forest Ecology and Management, 78(1-3), pp. 127-138. DOI: 10.1016/0378-1127(95)03590-0.
- Site Description
- Site(s) type(s): Boreal forest
- Geography
- latitude, longitude: 53.5, -125
- Site(s) history: plant grown in field wild
- Experimental or sampling design
- Design characteristics: Sample trees are collected from an age chronosequency of Populus tremuloides natural stands. The sampled stands represent the whole range of site conditions of the species distribution; i.e. from poor to medium and good site productivity. All sample trees were dominant trees.
- Variables included: status, a.stbh, h.t, d.bh, h.bh, m.lf, m.sb, m.st, m.so, m.br
- Species sampled: Populus tremuloides Michx.
- Research methods
- Leaf area: Leaf area was not measured. However, we can calculate the leaf area by using specific leaf area of Populus tremuloides to convert the leaf biomass data into leaf area data.
- Stem cross sectional area: We can calculate stem cross sectional area by using the diameter at breast height.
- Biomass: After felling all branches were weighed fresh in the field. Subsamples of the crown (10% of crown for all trees >5 cm DBH and 100% for trees <5 cm DBH) was dried at 70degC for 48h to obtain the dry to fresh weight ratio.
- Height: Because all sample trees were at different ages, they have different height.
- Year collected: 1991-1992
- Study contacts: Jian R. Wang
Wang1996
Data from: Wang J, Zhong A, Simard S and Kimmins J (1996). Aboveground biomass and nutrient accumulation in an age sequence of paper birch (Betula papyrifera) in the Interior Cedar Hemlock zone, British Columbia. Forest Ecology and Management, 83(1-2), pp. 27-38. DOI: 10.1016/0378-1127(96)03703-6.
- Site Description
- Site(s) type(s): Boreal forest
- Geography
- latitude, longitude: 53, -121.5
- Site(s) history: plant grown in field wild
- Experimental or sampling design
- Design characteristics: Sample trees are collected from an age chronosequency of Betula papyrifera natural stands. The sampled stands represent the whole range of site conditions of the species distribution; i.e. from poor to medium and good site productivity. All sample trees were dominant trees.
- Variables included: status, a.stbh, h.t, d.bh, h.bh, m.lf, m.sb, m.st, m.so, m.br
- Species sampled: Betula papyrifera Marsh
- Research methods
- Leaf area: Leaf area was not measured. However, we can calculate the leaf area by using specific leaf area of Betula papyrifera to convert the leaf biomass data into leaf area data.
- Stem cross sectional area: We can calculate stem cross sectional area by using the diameter at breast height.
- Height: Because all sample trees were at different ages, they have different height.
- Year collected: 1991-1992
- Study contacts: Jian R. Wang
Wang2000
Data from: Wang JR, Letchford T, Comeau P and Kimmins J (2000). Above- and below-ground biomass and nutrient distribution of a paper birch and subalpine fir mixed-species stand in the Sub-Boreal Spruce zone of British Columbia. Forest Ecology and Management, 130(1-3), pp. 17-26. DOI: 10.1016/S0378-1127(99)00193-0.
- Site Description
- Site(s) type(s): Boreal forest
- Geography
- latitude, longitude: 54.5, -125.5
- Site(s) history: plant grown in field wild
- Experimental or sampling design
- Design characteristics: Sample trees are collected from Betula papyrifera and Abies lasiocarpa mixed-wood forest natural stands. All Betula papyrifera sample trees were dominant trees, and Abies lasiocarpa sample trees are co-dominate and suppressed trees.
- Variables included: status, a.stba, a.stbh, h.t, h.c, d.ba, d.bh, h.bh, c.d, m.lf, m.sb, m.st, m.so, m.br, m.rf, m.rc, m.rt, m.to
- Species sampled: Abies lasiocarpa, Betula papyrifera
- Research methods
- Leaf area: Leaf area was not measured. However, we can calculate the leaf area by using specific leaf area of Betula papyrifera and Abies lasiocarpa to convert the leaf biomass data into leaf area data.
- Stem cross sectional area: We can calculate stem cross sectional area by using the diameter at breast height.
- Height: Because all sample trees were at different ages, they have different height.
- Year collected: 1996
- Study contacts: Jian R. Wang
Wang2011
Data from: Wang F, Kang M, Lu Q, Letort V, Han H, Guo Y, Reffye PD and Li B (2011). A stochastic model of tree architecture and biomass partitioning: application to Mongolian Scots Pines. Annals of Botany, 107(5), pp. 781-792. DOI: 10.1093/aob/mcq218.
- Site Description
- Site(s) type(s): Temperate forest
- Geography
- latitude, longitude: 42.72, 122.3667
- Site(s) history: plant grown in plantation managed
- Experimental or sampling design
- Design characteristics: Samples of 1-, 2-, 3-, 5- and 6-year-old trees were also taken for destructive measurements of biomass and geometry with four replications for each tree age.
- Variables included: status, age, a.lf, a.stba, h.t, d.ba, m.lf, m.st, m.so, m.br, m.to
- Species sampled: Pinus sylvestris var. mongolica
- Research methods
- Leaf area: A needle area is computed from its length L and diameter R based on the allometric relationship provided for Mongolian Scots pine. S=2.57*R(L-0.1167) (Jiao, 1982). I randomly sampled more than 20 needles in the experiments. I didnt take the samples for each individual and didnt consider the position of leaves in the plant. The specific leaf area can be fitted by leaves area and biomass of these samples. Finally, the Leaf Area was calculated by their biomass and specific leaf area.
- Stem cross sectional area: We have provide the Stem diameter at base(d), then the stem cross sectional area(S) can be calculated as equation S=pi/4*d^2.
- Height: Because trees are young, the heights of most samples are less than one meter. We directly measured the tree height by tape.
- Biomass: Samples were taken for destructive measurements of biomass and geometry. To prevent water loss during measurement, plants were dug up with their roots and soil and transported to the laboratory.
- Year collected: 2006-2007
- Study contacts: Wang Feng
Watanabe1984
Data from: Watanabe T and Yagi K (1984). Above-ground biomass and its vertical distribution in a plantation of Quercus myrsinaefolia. Technical Report 23, Miscellaneous information, the Tokyo University Forests.
- Site Description
- Site(s) type(s): Temperate forest
- Geography
- latitude, longitude: 35.738, 139.537
- Site(s) history: plant grown in plantation managed
- Experimental or sampling design
- Design characteristics: Sample trees were felled in a Quercus myrsinaefolia plantation located in the compartment II-11 of the Tanashi Experimental Field, University of Tokyo (60 m a.s.l.) in December of 1978. Three-year old seedlings were planted in July 1972. Density was 7043 trees/ha in 1978. Twelve trees were selected to represent each size class. Sample trees were cut down at ground level and then treated with the stratified clip technique by cutting them into parts contained in horizontal layers of 0.5 m depth and divided into stem, branches, and leaves.
- Variables included: age, a.lf, a.stbh, h.t, d.bh, h.bh, m.lf, m.st, m.so, m.br
- Species sampled: Quercus myrsinaefolia
- Research methods
- Leaf area: Leaf area of each layer was also estimated for each tree from dry mass and the ratio of leaf area to mass. The ratio was obtained for each layer. Leaf area of subsample was measured with an automatic planimeter (Hayashi-Denko AAM-7).
- Stem cross sectional area: Estimated from stem diameter.
- Height: Method not reported.
- Biomass: Measured fresh mass was converted to dry mass from the ratio of dry to fresh mass. The ratio was estimated from subsample taken from each tree and each layer. Subsamples were oven-dried at 85 degC for more than 18 h.
- Other variables: M.I. Ishihara, H. Utsugi, H. Tanouchi, and T. Hiura conducted formal search of reference databases and digitized raw data from Watanabe and Yagi (1984). Based on this reference, meta data was also created by M.I. Ishihara. Species name and family names were converted by M.I. Ishihara according to the following references: Satake Y, Hara H (1989a) Wild flower of Japan Woody plants I (in Japanese). Heibonsha, Tokyo; Satake Y, Hara H (1989b) Wild flower of Japan Woody plants II (in Japanese). Heibonsha, Tokyo.
- Study contacts: Masae I. Ishihara, Hajime Utsugi, Hiroyuki Tanouchi, Tsutom Hiura
Watanabe1985
Data from: Watanabe T and Yagi K (1985). Above-ground biomass and its vertical distribution of a young Quercus serrata plantation. Bulletin of the Tokyo University Forests, 74, pp. 165-174.
- Site Description
- Site(s) type(s): Temperate forest
- Geography
- latitude, longitude: 35.739, 139.538
- Site(s) history: plant grown in plantation managed
- Experimental or sampling design
- Design characteristics: Sample trees were felled in a 4 year-old Quercus serrata plantation located in the compartment II-10 of the Tanashi Experimental Field, University of Tokyo (60 m a.s.l.) in November of 1978. Trees were planted in the spring of 1974. Density was ca. 6800 trees/ha in 1978. After measuring diameter and tree height, 12 trees representing each size class were selected. Sample trees were cut down at ground level and then treated with the stratified clip technique by cutting them into parts contained in horizontal layers of 0.5 m depth and divided into stem, old branches, new branches, and leaves.
- Variables included: age, a.lf, a.stbh, h.t, d.bh, h.bh, m.lf, m.st, m.so, m.br
- Species sampled: Quercus serrata
- Research methods
- Leaf area: Because Quercus serrata is a deciduous tree and the sampling was conducted in Autumn, leaf area and leaf biomass were assumed to be smaller as a representative value during the growing season. Leaf area of each layer was estimated for each tree from dry mass and the ratio of leaf area to mass. The ratio was obtained for each layer. Leaf area of subsample was measured with an automatic planimeter (Hayashi-Denko AAM-7).
- Stem cross sectional area: Estimated from stem diameter.
- Height: Method not reported.
- Biomass: Measured fresh mass was converted to dry mass from the ratio of dry to fresh mass. The ratio was estimated from subsample taken from each tree and each layer. Subsamples were oven-dried at 85 degC for more than 48 h.
- Other variables: M.I. Ishihara, H. Utsugi, H. Tanouchi, and T. Hiura conducted formal search of reference databases and digitized raw data from Watanabe and Yagi (1985). Based on this reference, meta data was also created by M.I. Ishihara. Species name and family names were converted by M.I. Ishihara according to the following references: Satake Y, Hara H (1989a) Wild flower of Japan Woody plants I (in Japanese). Heibonsha, Tokyo; Satake Y, Hara H (1989b) Wild flower of Japan Woody plants II (in Japanese). Heibonsha, Tokyo.
- Study contacts: Masae I. Ishihara, Hajime Utsugi, Hiroyuki Tanouchi, Tsutom Hiura
Wenk0000
Data from: Wenk EH and Falster DS (Unpublished).
- Site Description
- Site(s) type(s): Woodland
- Geography
- latitude, longitude: -33.59307, 151.2831
- Site(s) history: plant grown in field wild
- Experimental or sampling design
- Design characteristics: Individuals were sampled across sites of known time since last fire. At each site we chose healthy growing individuals.
- Variables included: age, a.lf, a.stba, h.t, d.ba, m.lf, m.st, m.so, a.ilf, ma.ilf
- Species sampled: Banksia ericifolia, Boronia ledifolia, Conospermum ericifolium, Epacris microphylla, Grevillea buxifolia, Grevillea speciosa, Hakea teretifolia, Hemigenia purpurea , Leucopogon esquamatus, Persoonia lanceolata, Petrophile pulchella, Phyllota phylicoides, Pimelea linifolia, Pultenaea tuberculata
- Research methods
- Height: Measured from base of plant to apex
- Biomass: Plants were harvested, dried and weighed.
- Leaf area: Caluclated from using an estimate of LMA and measured leaf biomass.
- Traits: LMA was calculated on samples taken from top, middle and base of plants growing nearby and similar-to those used for biomass measures. LMA was estimated by scanning fresh leaves then weighing and measuring dry mass.
- Study contacts: Elizabeth Wenk, Daniel S. Falster
Whittaker1974
Data from: Whittaker RH, Bormann FH, Likens GE and Siccama TG (1974). The Hubbard Brook Ecosystem Study: Forest Biomass and Production. Ecological Monographs, 44(2), pp. 233-254. DOI: 10.2307/1942313.
- Site Description
- Site(s) type(s): Temperate forest
- Geography
- latitude, longitude: 44, -72
- Site(s) history: plant grown in field wild
- Experimental or sampling design
- Design characteristics:
- Variables included: age, a.stbh, h.t, d.bh, h.bh, m.lf, m.st, m.so, m.br, m.rt, m.to
- Species sampled: Acer pensylvanicum, Acer saccharum, Betula alleghaniensis, Fagus grandifolia, Picea rubens
- Research methods
- grouping: trees were sampled in three elevation bands west of watershed 6 at the Hubbard Brook Experimental Forest. L = 550-630m; M = 630-710m; H = 710-785m.
- m.lf: The crown was divided into 5 height ranges and a random living branch was chosen from each section. Freshweight of livind wood, dead wood, current twigs with leaves and older leaves were weighed fresh in the field then dried at 105oC to obtain dry weight.
- m.br: branch mass includes both dead and live branches
- m.rt: total belowground mass, including the root crown; as described in Vadeboncoeur et al. 2007 Can. J. For. Res. 37: 1777-1783. DOI: 10.1139/X07-032
- Year collected: 1965
- Study contacts: Matthew A. Vadeboncoeur, John J. Battles
Williams2005
Data from: Williams R, Zerihun A, Montagu K, Hoffman M, Hutley L and Chen X (2005). Allometry for estimating aboveground tree biomass in tropical and subtropical eucalypt woodlands: towards general predictive equations. Aust. J. Bot., 53(7), pp. 607-619. LINK.
- Site Description
- Site(s) type(s): Woodland, Savannah
- Geography
- latitude, longitude: -23.08, 149.33; -23.1, 147; -23.75, 146; -12.5, 131.3; -14.7, 132.7; -14.5, 132.4; -16.1, 131.9; -14.6, 132.2; -23.17, 150.56; -30.92, 146.5
- Site(s) history: plant grown in field wild
- Experimental or sampling design
- Design characteristics: Published and unpublished data sets for multiple species and sites across Australia were utilized to determine allometric relationships for tropical and subtropical euclaypt woodlands. A total of 220 individual trees of various sizes (basal area range: ~4 to 10 m2) were sampled to determine dry weight of leaves, branches and stems and allometric relationships. Trees grew under a range of enviroments from the wet-dry tropical region of the Northern Territory to the major savanna and woodland types of central and eastern Queensland, and New South Wales.
- Variables included: a.lf, a.stbh, h.t, h.c, d.bh, h.bh, c.d, m.lf, m.sb, m.st, m.so, m.br
- Species sampled: Erythrophleum chlorstachys, Eucalyptus bleeseri, Eucalyptus creba, Eucalyptus foelscheana, Eucalyptus melanophloia, Eucalyptus miniata, Eucalyptus patellaris, Eucalyptus populnea, Eucalyptus porrecta, Eucalyptus pruinosa, Eucalyptus tectifica, Eucalyptus terminalis, Eucalyptus tetrodonta, Terminalia ferdinandiana
- Research methods
- Height: Height was measured as the vertical distance from the ground to the highest apex.
- Biomass: Aboveground biomass was estimated by direct harvest techniques. Trees were felled and separated into the component parts of trunk, branches and leaves. Fresh weight of all material was weighed and subsamples were dried at 65-80oC until constant mass for determination of the dry-mass correction factor.
- Other variables: Mean annual rainfall provided where available.
- Study contacts: Richard Williams, Lindsay Hutley
Ximenes2004
Data from: Ximenes F, Gardner W and Marchant J (2004). Total biomass measurement and recovery of biomass in log products in spotted gum (Corymbia maculata) forests of SE NSW. National Carbon Accounting System Technical Report, 47, pp. 1-92.
- Site Description
- Site(s) type(s): Temperate forest
- Geography
- latitude, longitude: -35.45, 150.2; -35.41667, 150.3; -35.73333, 150.0667
- Site(s) history: plant grown in field wild
- Experimental or sampling design
- Design characteristics: At the establishment of the plots all trees above 10 cm DBH (including dead trees) were numbered, identified and their DBH measured. The tree was harvested using a chainsaw. The stumps were numbered with the corresponding tree number and the height of each stump was measured. Most of the trees were snigged to the logging dump by a skidder or excavator; large trees had their crown component cut in the forest and each component snigged to the logging dump separately. A visual assessment was made to estimate any losses (crown, branches and bark) that may have occurred due to transport of the trees from the forest to the logging dump and their handling. The length, and butt, top and centre diameters of each log were measured. Samples were cut from the log products, crown and bark for laboratory analysis (moisture content, density and sapwood content).
- Variables included: a.stbh, h.t, d.bh, h.bh, m.sb, m.so
- Species sampled: Acacia spp., Corymbia maculata, Eucalyptus eugenioides, Eucalyptus muellerana, Eucalyptus paniculata, Eucalyptus resinifera, Eucalyptus saligna
- Research methods
- Biomass: Trees weighing less than five tonnes were weighed as a whole. Trees heavier than five tonnes required further cutting before their weight was determined. The commercial log(s) was debarked, graded and weighed. The biomass was weighed on weigh bars mounted on top of a trailer especially designed and built for the CRCGA research. An excavator was used to lift the biomass components onto the trailer. The trailer is equipped with a heavy upper frame and each corner is supported by a two-speed drop leg. The nominal dimensions of the trailer are: length load space: 2.5 m; length overall: 4.1m; width load space: 1.8 m; width overall: 1.8m. Both weigh bars are equipped with two load cells with a combined capacity of 5 tonnes. Weight increments of 0.2 kg are displayed on a digital display. The weight of stumps was determined by multiplying their volume by the green density of the butt section of the respective tree. The volume of the stumps was determined assuming, for practical reasons, they approached the form of the cylinder (Husch et al 1972). The weight of trees that had a component of bark, crown or branches missing was adjusted based on a visual assessment of the loss.
- Year collected: 2003
- Study contacts: Fabiano de Aquino Ximenes
Yamaba2007
Data from: Yamaba A (2007). Estimation of underground biomass of major tree species in forests, Hiroshima prefecture. Bulletin of the Hiroshima Prefectural Forestry Research Center, 39, pp. 23-30.
- Site Description
- Site(s) type(s): Temperate forest
- Geography
- latitude, longitude: 34.78, 132.85; 34.91, 132.95; 34.8, 132.91; 34.96, 133.23; 34.48, 132.7
- Site(s) history: plant grown in plantation managed, field wild
- Experimental or sampling design
- Design characteristics: Quercus serrata were sampled in two Q. serrata dominated secondary natural forests in 2005: Miyoshi city-1 (215 m a.l.s; NE facing slope; slope = 13 degrees) and Shobara city-2 (580 m; NE; 28 degrees) (Yamaba 2007). Both sites used to be dominated by Pinus densiflora before many pine trees were killed by pine wilt disease. P. densiflora were sampled in P. densiflora dominated secondary natural forest at Higashihiroshima city-3 (415 m; SE; 5 degrees) in August 2006. Chamaecyparis obtusa was sampled in two plantations in 2004: Miyoshi city-Toukaichimachi (207m; E; 12 degrees) and Shobara city-Nigorikawachyo (484 m; SW; 33 degrees). Within each site, 20 times 20 m quadrate was created and stem diameter at breast height and tree height of all trees within the quadrate were measured. One dominant tree, two average-sized trees, and one suppressed tree were chosen from each quadrate and were cut down. Sample trees were treated with the stratified clip technique by cutting them into parts contained in horizontal layers of 0.2-1.2 m, and at intervals of 1 m upward for evergreen gymnosperm and in horizontal layers of 0.2-3.2 m, and at intervals of 3 m upward for Q. serrata and divided into stem, branches, leaves, and dead branches and leaves. Green parts of C. obtusa were categorized as leaves. Leaves of P. densiflora were easily divided from branches because sampling was conducted in August when the leaves are elongated. Coarse roots were excavated by a winch and the remained roots were dug up manually. After soil was washed away, roots were divided by the root diameter class. Because the Q. serrata tree with diameter at breast height (d.bh) = 0.341 m was multi-stemmed, d.bh and tree height (h.t) were calculated as: d.bh = 2*square root (total basal area of all stems/pi); h.t = mean height of all stems.
- Variables included: age, a.stbh, h.t, d.bh, h.bh, m.lf, m.st, m.so, m.br, m.rt, m.to
- Species sampled: Chamaecyparis obtusa, Pinus densiflora, Quercus serrata
- Research methods
- Stem cross sectional area: Estimated from stem diameter.
- Height: Tree height was measured by measuring tape after trees were cut down.
- Biomass: Each component in each layer or each diameter class was weighted (Yamaba 2007). Fresh mass was converted to dry mass from the dry/fresh mass ratio. The ratio was estimated from subsamples taken for each component and each layer for aboveground and for each diameter class for roots. Subsamples were oven-dried at 105 degree C until there was no change in the mass. Dry mass of dead branches and leaves were not included in this data paper (see Yamaba 2007 for the dry mass for these components). For fine roots (diameter > 5 mm) that were unavailable to dug up, dry mass was estimated from the root diameter at the distal end where the roots were missing using the allometric equation log(dry mass) = a*log(D^2)+b where D is root diameter at the distal end and a and b are parameters. This equation was obtained from samples collected in the same stands as the felled trees.
- Other variables: Species name and family names were converted by M.I. Ishihara according to the following references: Satake Y, Hara H (1989a) Wild flower of Japan Woody plants I (in Japanese). Heibonsha, Tokyo; Satake Y, Hara H (1989b) Wild flower of Japan Woody plants II (in Japanese). Heibonsha, Tokyo.
- Study contacts: Atsushi Yamaba
Yamada1957
Data from: Yamada S, Maruyama K and Miyazawa S (1957). Biomass of Pinus densiflora mature trees along topographic gradient. Bulletin of the Japan Forest Society, 67, pp. 218-222.
- Site Description
- Site(s) type(s): Temperate forest
- Geography
- latitude, longitude: 37.8, 139.3
- Site(s) history: plant grown in plantation managed
- Experimental or sampling design
- Design characteristics: Sampling was conducted in 10 plots in May 1956. These plots were in 53-year-old Pinus densiflora plantation located in compartment 93-i of the national forest in Sasakami village, Niigata, Japan. Averaged sized tree was selected and cut down at ground level from each plot. Tree height, height of the lowest living branch, and stem diameters at breast height were measured. Sample trees were then divided into stem, branches, and leaves.
- Variables included: age, a.stbh, h.t, h.c, d.bh, h.bh, c.d, m.lf, m.st, m.so, m.br
- Species sampled: Pinus densiflora
- Research methods
- Stem cross sectional area: Estimated from stem diameter.
- Height: Method not reported.
- Biomass: Measured fresh weight was converted to dry weight from the ratio of dry to fresh weights. The ratio was estimated from subsamples.
- Other variables: M.I. Ishihara, H. Utsugi, H. Tanouchi, and T. Hiura conducted formal search of reference databases and digitized raw data from Yamada et al. (1957). Based on this reference, meta data was also created by M.I. Ishihara. Species name and family names were converted by M.I. Ishihara according to the following references: Satake Y, Hara H (1989a) Wild flower of Japan Woody plants I (in Japanese). Heibonsha, Tokyo; Satake Y, Hara H (1989b) Wild flower of Japan Woody plants II (in Japanese). Heibonsha, Tokyo.
- Study contacts: Masae I. Ishihara, Hajime Utsugi, Hiroyuki Tanouchi, Tsutom Hiura
Yamada1996
Data from: Yamada T and Suzuki E (1996). Ontogenic change in leaf shape and crown form of a tropical tree, Scaphium macropodum (Sterculiaceae) in Borneo. Journal of Plant Research, 109(2), pp. 211-217. DOI: 10.1007/BF02344547.
- Site Description
- Site(s) type(s): Tropical rainforest
- Geography
- latitude, longitude: 0.75, 110.1
- Site(s) history: plant grown in field wild
- Experimental or sampling design
- Design characteristics: Trees without any evidence of breakage were collected from closed stands.
- Variables included: status, a.stba, a.stbh, a.cp, h.t, h.c, d.ba, d.bh, h.bh, d.cr, c.d, m.lf, m.st, m.so, m.br
- Species sampled: Scaphium macropodum
- Research methods
- Leaf area: Leaf areas were measured for 108 leaves taken from 11 sample trees of 37 cm to 1870 cm in height.
- Stem cross sectional area: Measured by a caliper in two directions
- Height: Measured by a measuring tape.
- Crown area: Measured by a measuring tape.
- Biomass: Fresh weights were measured and some samples were oven dried and weighed. And the fresh weights were later converted to oven dry weights.
- Traits: A species with moderately shade tolerance.
- Year collected: 1992-1993
- Study contacts: Toshihiro Yamada
Yamada2000
Data from: Yamada T, Yamakura T and Lee HS (2000). Architectural and allometric differences among Scaphium species are related to microhabitat preferences. Functional Ecology, 14(6), pp. 731-737. DOI: 10.1046/j.1365-2435.2000.00479.x.
- Site Description
- Site(s) type(s): Tropical rainforest
- Geography
- latitude, longitude: 4.12, 114
- Site(s) history: plant grown in field wild
- Experimental or sampling design
- Design characteristics: trees that showed no evidence of past breakage were collected
- Variables included: status, a.stba, a.cp, h.t, h.c, d.ba, d.cr, c.d, m.lf, m.st, m.so, m.br
- Species sampled: Scaphium borneense, Scaphium longipetiolatum, Scaphium macropodum
- Research methods
- Leaf area: Leaf area was determined with a scanner (Epson EP Scan GT-8000) combined with an area-determination software (Adobe Photoshop 2.5J.
- Stem cross sectional area: It was defined as the geometric mean of the two stem diameters measured.
- Height: Measured by a measuring tape.
- Crown area: This was calculated as the projection of an ellipse defiend byt eh tow crown diameters.
- Biomass: The sample trees were cut into four fractions; leaves
- petioles: branches adn stems
- that were dried seperately at 80oC for 1 week in an oven and their oven dry mass were measured.:
- Traits: Species with moderately shade tolerance for all
- Year collected: 1996
- Study contacts: Toshihiro Yamada
Yamaji1991
Data from: Yamaji K (1991). On the estimation of radiation interception by woody organs in a hinoki plantation. Masters thesis, Faculty of Agriculture, Nagoya University, Japan.
- Site Description
- Site(s) type(s): Temperate forest
- Geography
- latitude, longitude: 34.9, 137.6
- Site(s) history: plant grown in plantation managed
- Experimental or sampling design
- Design characteristics: The allometric relationships between different dimensions of a hinoki (Chamaecyparis obtusa (Sieb. Et Zucc.) Endl.) tree were examined on the basis of 55 destructive samples, which were collected from four different stands and whose age ranged from 12 to 59 years (Hagihara1993). Only 6 sample trees are reported here. For the rest of 49 trees see Hagihara1993, Iijima1991, Mori1991, Nakagaki1983, and Tanao1982. Biomass and leaf area estimates were determined by the stratified clip technique, in which the stratum was 0.0-0.3 m, 0.3-1.3 m, 1.3-2.3 m, and at intervals of 1 m upward.
- Variables included: age, a.lf, a.stbh, a.stbc, h.t, h.c, d.bh, h.bh, c.d, m.lf, m.st, m.so, m.br
- Species sampled: Chamaecyparis obtusa
- Research methods
- Leaf area: Leaf area was determined with area meters (Murayama NCE-3, Hayashi AAC-100, Hayashi AAM-5) on subsamles and was then extrapolatied to total leaf area using specific leaf area from each stratum and summing up each stratum. Specific leaf area was estimated from a sample of leaves used for estimating the ratio of dry/fresh weight and area. Total leaf weight was measured for each stratum.
- Stem cross sectional area: Estimated from stem diameter.
- Height: Height was measured as the vertical distance from the ground surface to the highest apex of each tree.
- Biomass: Trees were separated into roots, stems, branches and leaves, and then weighed. Sub-samples of the total fresh weight were taken and dried in ventilated ovens at 85 degC for a few days for fresh mass/dry mass estimates. The fresh biomass was converted into dry biomass estimates of roots, stem, branches and leaves per tree using the respective dry/fresh mass ratios.
- Study contacts: Akio Hagihara
Yamakura1972
Data from: Yamakura T, Saito H and Shidei T (1972). Production and structure of under-ground part of Hinoki (Chamaecyparis obtusa) stand (I) Estimation of root production by means of root analysis. Journal of the Japanese Forest Society, 54, pp. 118-125.
- Site Description
- Site(s) type(s): Temperate forest
- Geography
- latitude, longitude: 35, 136.3
- Site(s) history: plant grown in plantation managed
- Experimental or sampling design
- Design characteristics: Sampling was conducted in a 30 year-old Chamaecyparis obtusa plantation located on a slope of Mt. Watamuki, Shiaga, Japan (Yamakura et al. 1972). A sample plot (20 m times 15 m) was created in April of 1968. Six sample trees covering the size range were felled in November 1968. Stem diameter at 0.0 and 1.3 m aboveground, stem diameter just below the lowest living branch, stem diameter at 1/10 of tree height, tree heigh, clear bole length, and crown radius in two direction were measured. Sample trees were then treated with the stratified clip technique by cutting them into parts contained in horizontal layers of 1 m depth and separated into stem, branches, and foliage. Roots were cut into stump root and lateral roots and each was excavated by stump pulling apparatus. Most of the roots < 2 mm in diameter were torn off at pulling. To estimate fine root biomass of a plot, ten trenches, 0.5 times 0.5 times 1.0 m, were dug out. The estimate of fine root is not included in this data.
- Variables included: a.stba, a.stbh, a.stbc, a.cp, h.t, h.c, d.ba, d.bh, d.cr, c.d, m.lf, m.st, m.so, m.br, m.rt, m.to
- Species sampled: Chamaecyparis obtusa
- Research methods
- Stem cross sectional area: Estimated from stem diameter.
- Height: Tree height and height to the lowest living branch were measured.
- Biomass: Measured fresh mass was converted to dry mass from the ratio of dry to fresh mass. The ratio was estimated from subsamples taken for each component (stem, branch, foliage, and root) and each layer. These samples were mixed for each tree and each component. Fresh mass for stem ranged 772-1618 g. Subsamples were oven-dried at 80 deg C.
- Study contacts: Takuo Yamakura, Masae I. Ishihara, Hajime Utsugi, Hiroyuki Tanouchi, Tsutom Hiura
Yamakura1986
Data from: Yamakura T, Hagihara A, Sukardjo S and Ogawa H (1986). Tree size in a mature dipterocarp forest stand in Sebulu, East Kalimantan, Indonesia. Southeast Asian Studies, 23(4), pp. 452-478.
- Site Description
- Site(s) type(s): Tropical rainforest
- Geography
- latitude, longitude: -1.5, 116.967
- Site(s) history: plant grown in field wild
- Experimental or sampling design
- Design characteristics: One-hundred and nintey-one trees were felled, and their total height, clear bole length, crown diameter, stem diameter at 1/10 of Height, stem diameter just below the lowest living branch, stem diameters at 0.0 and 1.3 m aboveground and stem diameters at 5.0 m intervals were measured. Biomass from felled trees was estimated using the stratified clip technique. The tree body in each stratum (0.0-1.3 m, 1.3-5 m, 5-10 m, and then at intervals of 5m) was separated into stem, branches and leaves and each organ was weighed with balances appropriate to the size of the organ. Subsamples of stems, branches and leaves were taken from each stratum of sample trees for estimating the ratio of fresh/dry mass, specific gravity of stem and leaf area. Leaf samples were either traced by hand or photocopied.
- Variables included: a.lf, a.stba, a.stbh, a.cp, h.t, h.c, d.ba, d.bh, h.bh, d.cr, c.d, m.lf, m.st, m.so, m.br
- Species sampled: Aporosa elmeri, Aporosa sphaedophora, Artocarpus anisophyllus, Baccaurea deflexa, Baccaurea kunstleri, Baccaurea pendula, Baccaurea sp., Barringtonia macrostachy, Beilschmiedia sp., Dacryodes rugosa, Dialium indum, Dialium platycephalum, Dialium sp., Dillenia excelsa, Dillenia excemia, Dipterocarpus crinitus, Dryobalanops sp., Drypetes sp., Elaeocarpus sp., Eugenia cuprea, Eugenia sp., Girroniera nervosa, Hopea mangerawan, Horsfieldia grandis, Litsea noronhae, Litsea sp., Mallotus echinatus, Malotus echinatus, Milletia sericea, Myristica sp., Neoscortechinia kingii, Ochanostachys amentacea, Ochanostachys sp., Ostodes macrophylla, Oxymitra grandiflora, Polaquem dasyphyllum, Polyalthia glauca, Polyalthia rumphii, Pometia tomentosa, Santiria operculata, Santiria tomentosa, Shorea laevis, Shorea leprosula, Shorea ovalis, Sindora sp., Sterculia rubiginosa, Strombosia rotundifolia, Strombosia sp., Unidentified sp., Xanthophyllum heteropleurum
- Research methods
- Leaf area: Leaf area for each stratum was calculated by multipling total leaf weight by the corresponding specific leaf area of subsampled leaves (traced by hand or photocopied and calculated using a planimeter or counting squares), and then the leaf area values of all of the strata were added to obtain leaf area per tree.
- Stem cross sectional area: Stem diameter was measured at multiple points along the tree (0.0, 1/10 the height of the tree, 130 cm aboveground, just below the lowest living branch, and at 5.0 m intervals along the full height of the tree).
- Height: Height was measured as the vertical distance from the ground surface to the highest apex of each tree.
- Biomass: Trees were separated into stems, branches and leaves according to different height strata (0-1.3m, 1.3-5m, 5-10m and then at intervals of 5 m), and then weighed fresh in the field. Sub-samples from each strata were dried at 80oC for at least 7 days to obtain fresh mass/dry mass ratios.
- Year collected: 1980-1981
- Study contacts: Takuo Yamakura
Yasui1970
Data from: Yasui H and Fujie I (1970). Studies on the productive structure of Shirakashi (Cyclobalanopsis myrsinaefolia Oerst.) coppice-forest managed by selection method. 7. On the growth of third circulation-period at the Shimoyamasa permanent plot. Bulletin of the Faculty of Agriculture, Shimane University, 4, pp. 85-92.
- Site Description
- Site(s) type(s): Temperate forest
- Geography
- latitude, longitude: 35.35, 133.15
- Site(s) history: plant grown in plantation managed
- Experimental or sampling design
- Design characteristics: Forty-eight trees were selectively cut in a Quercus myrsinaefolia coppice forest (Shimoyamasa, Hirose cho, Shimane Prefecture, Japan) in November 1969. Prior to this selective cut, the forest was selectivelycut in 1959, 1962, and 1966. By the first selective cut in 1959, the forest was made into nearly pure stand of Quercus myrsinaefolia. Within 48 felled trees, 16 sample trees were treated with the stratified clip technique by cutting them at the interval of 0.74 m and stem discs were collected. Branches and leaves were separated from stem in each 0.74 m layer and weighted for the fresh mass.
- Variables included: age, a.stbh, h.t, d.bh, h.bh, m.lf, m.st, m.so, m.br
- Species sampled: Quercus myrsinaefolia
- Research methods
- Stem cross sectional area: Estimated from stem diameter.
- Height: Method not reported.
- Biomass: Measured fresh mass of each component (stem, branch, and leaves) was converted to dry mass from the ratio of dry to fresh mass. The ratio was estimated from subsamples taken. About 4 kg of branches or leaves were used for subsample. For stem, discs were used for subsamples. Subsamples were oven-dried at 105 degC for 24 h. The ratio was 0.72-0.84 for stem, 0.51 and 0.45 for branches and leaves, in average.
- Other variables: M.I. Ishihara, H. Utsugi, H. Tanouchi, and T. Hiura conducted formal search of reference databases and digitized raw data from Yasui and Fujie (1970). Based on this reference, meta data was also created by M.I. Ishihara. Species name and family names were converted by M.I. Ishihara according to the following references: Satake Y, Hara H (1989a) Wild flower of Japan Woody plants I (in Japanese). Heibonsha, Tokyo; Satake Y, Hara H (1989b) Wild flower of Japan Woody plants II (in Japanese). Heibonsha, Tokyo.
- Study contacts: Masae I. Ishihara, Hajime Utsugi, Hiroyuki Tanouchi, Tsutom Hiura
Yasui1971
Data from: Yasui H and Fujie I (1971). Studies on the productive structure of Shirakashi (Cyclobalanopsis myrsinaefolia Oerst.) coppice-forest managed by selection method. 8. On the growth and the biomass at Shirakashi sprout forest by clearing system. Bulletin of the Faculty of Agriculture, Shimane University, 5, pp. 49-55.
- Site Description
- Site(s) type(s): Temperate forest
- Geography
- latitude, longitude: 35.31, 133.27
- Site(s) history: plant grown in plantation managed
- Experimental or sampling design
- Design characteristics: Sampling was conducted in three Quercus myrsinaefolia forests (Takae, Hakuta village, Shimane Prefecture, Japan, ca. 300 m a.s.l.) in October 1970. These forests were regenerated from sprouts after clear cutting. The forest ages were 8, 15, and 25 years old for plot 1, 2, and 3 respectively. Sample trees were treated with the stratified clip technique by cutting them at the interval of 0.74 m and stem discs were collected. Branches and leaves were separated from stem in each 0.74 m layer and weighted for the fresh mass.
- Variables included: age, a.stbh, h.t, d.bh, h.bh, m.lf, m.st, m.so, m.br
- Species sampled: Quercus myrsinaefolia
- Research methods
- Stem cross sectional area: Estimated from stem diameter.
- Height: Method not reported.
- Biomass: Measured fresh mass of each component (stem, branch, and leaves) was converted to dry mass from the ratio of dry to fresh mass. The ratio was estimated from subsamples taken. About 4 kg of branches or leaves were used for subsample. For stem, discs were used for subsamples. Subsamples were oven-dried at 105 degC for 24 h.
- Other variables: M.I. Ishihara, H. Utsugi, H. Tanouchi, and T. Hiura conducted formal search of reference databases and digitized raw data from Yasui and Fujie (1970). Based on this reference, meta data was also created by M.I. Ishihara. Species name and family names were converted by M.I. Ishihara according to the following references: Satake Y, Hara H (1989a) Wild flower of Japan Woody plants I (in Japanese). Heibonsha, Tokyo; Satake Y, Hara H (1989b) Wild flower of Japan Woody plants II (in Japanese). Heibonsha, Tokyo.
- Study contacts: Masae I. Ishihara, Hajime Utsugi, Hiroyuki Tanouchi, Tsutom Hiura
Yasui1983
Data from: Yasui H, Fujie I and Yamamoto M (1983). Studies on the productive structure of Shirakashi (Cyclobalanopsis myrsinaefolia Oerst.) coppice-forest managed by selection method. 10. On the biomass in fifth circulation-period at the Shimoyamasa permanent plot. Bulletin of the Faculty of Agriculture, Shimane University, 17, pp. 29-33.
- Site Description
- Site(s) type(s): Temperate forest
- Geography
- latitude, longitude: 35.35, 133.15
- Site(s) history: plant grown in plantation managed
- Experimental or sampling design
- Design characteristics: Thirty-nine trees were selectively cut in a Quercus myrsinaefolia coppice forest (Shimoyamasa, Hirose cho, Shimane Prefecture, Japan) in November 1980. Prior to this selective cut, the forest was selectively cut in 1959, 1962, 1966, 1969 (Yasue and Fujie 1970). By the first selective cut in 1959, the forest was made into nearly pure stand of Quercus myrsinaefolia. Within 39 felled trees, 33 sample trees were treated with the stratified clip technique by cutting them at the interval of 0.8 m and stem discs were collected. Branches and leaves were separated from stem in each 0.74 m layer and weighted for the fresh mass.
- Variables included: age, a.stbh, h.t, d.bh, h.bh, m.lf, m.st, m.so, m.br
- Species sampled: Quercus myrsinaefolia
- Research methods
- Stem cross sectional area: Estimated from stem diameter.
- Height: Method not reported.
- Biomass: Measured fresh mass of each component (stem, branch, and leaves) was converted to dry mass from the ratio of dry to fresh mass. The ratio was estimated from subsamples taken. For stem, discs were used for subsamples. Subsamples were oven-dried at 105 degC for 72 h. For leaves, 1.88, 1.42, and 0.47 kg of leaves were collected as subsample from the upper, middle, and lower layers. The ratio was 0.50-0.59 for stem, 0.528 for branch, and 0.388 for leaves.
- Other variables: M.I. Ishihara, H. Utsugi, H. Tanouchi, and T. Hiura conducted formal search of reference databases and digitized raw data from Yasui et al. (1983). Based on this reference, meta data was also created by M.I. Ishihara. Species name and family names were converted by M.I. Ishihara according to the following references: Satake Y, Hara H (1989a) Wild flower of Japan Woody plants I (in Japanese). Heibonsha, Tokyo; Satake Y, Hara H (1989b) Wild flower of Japan Woody plants II (in Japanese). Heibonsha, Tokyo.
- Study contacts: Masae I. Ishihara, Hajime Utsugi, Hiroyuki Tanouchi, Tsutom Hiura
Yi1989
Data from: Yi M, Suzaki T and Yahata H (1989). Nutrient cycling of Pinus thunbergii forests on sand soil in coast (IV) Above ground biomass and nutrient contents of stands. Bulletin of Kyushu Branch of the Japanese Forestry Society, 42, pp. 201-202.
- Site Description
- Site(s) type(s): Temperate forest
- Geography
- latitude, longitude: 33.58, 130.3
- Site(s) history: plant grown in plantation managed
- Experimental or sampling design
- Design characteristics: Nine trees were felled in a Pinus thunbergii forest located in Ikunomatsubara, Kyushu University Forest. Sample trees were treated with the stratified clip technique by cutting them into parts contained in horizontal layers of 0-0.2 m, 0.2-1.2 m, and at intervals of 1 m upward. Stem, branches, and needles were separated.
- Variables included: a.stbh, h.t, d.bh, h.bh, m.lf, m.st, m.so, m.br
- Species sampled: Pinus thunbergii
- Research methods
- Stem cross sectional area: Estimated from stem diameter.
- Height: Method not reported.
- Biomass: Measured fresh weight was converted to dry weight from the ratio of dry to fresh weights. Detailed method not reported.
- Other variables: M.I. Ishihara, H. Utsugi, H. Tanouchi, and T. Hiura conducted formal search of reference databases and digitized raw data from Yi et al. (1989). Based on this reference, meta data was also created by M.I. Ishihara. Species name and family names were converted by M.I. Ishihara according to the following references: Satake Y, Hara H (1989a) Wild flower of Japan Woody plants I (in Japanese). Heibonsha, Tokyo; Satake Y, Hara H (1989b) Wild flower of Japan Woody plants II (in Japanese). Heibonsha, Tokyo.
- Study contacts: Masae I. Ishihara, Hajime Utsugi, Hiroyuki Tanouchi, Tsutom Hiura
Yoda1978
Data from: Nagano M and Kira T (1978). Aboveground biomass. JIBP synthesis Vol. 18 Biological production in a warm-temperate evergreen oak forest of Japan. University of Tokyo Press, pp. 69-82.
- Site Description
- Site(s) type(s): Temperate forest
- Geography
- latitude, longitude: 32.17, 130.59
- Site(s) history: plant grown in field wild
- Experimental or sampling design
- Design characteristics: The late Dr. Kyoji Yoda contributed largely in sampling. All large trees on the 20 m x 20 m sampling plot were cut at ground level in December 1973 (Nagano & Kira 1978). Stem diameter and tree height were measured immediately. Sample trees were then treated with the stratified clip technique by cutting them into parts contained in horizontal layers of 0-0.3 m, 0.3-1.3 m, 1.3-3.3 m, and at intervals of 2 m upward. Vine species, which were included in the original article, have been excluded in this compilation. Multiple-stemmed trees were also excluded for this data paper.
- Variables included: a.lf, a.stba, a.stbh, a.stbc, h.t, h.c, d.ba, d.bh, h.bh, c.d, m.lf, m.st, m.so, m.br
- Species sampled: Abies firma, Camellia sasanqua, Castanopsis cuspidata, Cleyera japonica, Eurya japonica, Ilex chinensis, Ilex integra, Litsea acuminata, Machilus japonica, Machilus thunbergii, Quercus gilva, Quercus glauca, Quercus salicina, Quercus sessilifolia, Symplocos lancifolia, Symplocos prunifolia
- Research methods
- Leaf area: Leaf area of each layer was also estimated for each tree by the same sampling procedure, from leaf dry weight and leaf area/leaf dry weight ratios (Nagano & Kira 1978). The ratio was obtained from direct measurement of the projected leaf area of subsampled leaves with an automatic planimeter (Hayashi-Denko AAM-5). For the Abies firma tree, projected shoot silhouette area was obtained by placing shoots on the planimeter. Shoot silhouette area was assumed to be equivalent to total needle projected area for this small tree. This assumption is reasonable because a previous study showed that suppressed Abies trees have the ratio of shoot silhouette area to needle projected area of 1-1.3 (Sprugel et al. 1996 Tree Physiol. 16:91-98).
- Stem cross sectional area: Estimated from stem diameter.
- Height: Measured by measuring tape after trees were cut down.
- Biomass: Fresh weights of leaves, branches, and stem were measured separately for each layer and each tree. They were later converted to corresponding oven-dry weights based on smaller subsamples of respective organs taken from each layer and trees (Nagano & Kira 1978) by Dr. Yoda. Subsamples were oven-dried for 85 degreeC.
- Other variables: Species name and family names were converted by M.I. Ishihara according to the following references: Satake Y, Hara H (1989a) Wild flower of Japan Woody plants I (in Japanese). Heibonsha, Tokyo; Satake Y, Hara H (1989b) Wild flower of Japan Woody plants II (in Japanese). Heibonsha, Tokyo.
- Year collected: 1973
- Study contacts: Masae I. Ishihara, Masahiro Nagano, Itsuo Miyata
CLASS III. DATA SET STATUS AND ACCESSIBILITY
A. Status
Latest update: The dataset made available through this publication was processed on 2014-12-15. Newer updates may be retrieved from the BAAD website github.com/dfalster/baad.
Metadata status: Metadata are complete to last update and are stored with data.
Data verification: The raw data passed through several rounds of review, to ensure units were correct, raw data was appropriately matched to variables in the BAAD, and to minimize outliers.
- Initial analysis by data contributors. The majority of studies have been published and as such have gone through quality assurance by the data contributor.
- Review by compilers of database. We have gone through extensive data verification by checking cross-correlations, credible ranges, and outliers of all variables in the database.
- All species names were matched against online databases with the R packages
Taxonstand and taxize R package (Cayuela, la Cerda, Albuquerque, and Golicher, 2012; Chamberlain and Szöcs, 2013).
- Additional review by contributors using reports generated from the data. In these reports, we summarized species, locations (latitude, longitude and maps), plant functional type, metadata provided by the contributor, and pair-wise plots of all numeric variables in the dataset (and a comparison to all data in the database). Each contributor checked the reports for problems, which allowed us to improve data quality in many cases.
- Derived variables were calculated from the raw data where appropriate. For example, a dataset may contain crown length and plant height but not height to crown base, in which case the latter was calculated from the other two variables.
B. Accessibility
1. Storage location and medium: The data published on Ecological Archives is the first release from the Biomass and allometry database (v1.0.0) stored at github.com/dfalster/baad. The version of the data contained in this publication can also be downloaded from the releases page on gihtub: github.com/dfalster/baad/releases. Development versions of the dataset will continue to be made available at github.com/dfalster/baad.
If you notice any problems with the dataset, please list an issue at github.com/dfalster/baad/issues/new.
Contact persons: Queries about individual specific data points can be directed to the contributing author for that study. For queries about the entire dataset, please contact either Daniel Falster or Remko Duursma. For problems with the dataset, please submit an issue as described above.
Copyright restrictions: The dataset is released under the the Creative Commons Zero public domain dedication. When using the dataset, we kindly request that you cite this article, recognizing the hard work that went into collecting the data and the authors willingness to make it publicly available.
Costs: None.
CLASS IV. DATA STRUCTURAL DESCRIPTORS
A. Data Set Files
The BAAD contains the following elements:
data: amalgamated dataset, with columns as defined in dictionarydictionary: a table of variable definitionsmetadata: a table with columns studyName,Topic,Description, containing written information about the methods used to collect the datamethods: a table with columns as in data, but containing a code for the methods used to collect the data. See config/methodsDefinitions.csv for codes.references: as both summary table (giving DOI, URL, citation) and bibtex entries containing the primary source for each studycontacts: table with contacts and affiliations for each study.
These elements are available as both
- a list within the file
baad.rds (for use in R)
- as a series of csv and text files.
B. Variable definitions for data.csv
- location
- Type: character
- Label: location
- Description: name of location where sampled
- Units: NA
- latitude
- Type: numeric
- Label: latitude
- Description: latitude of location where sampled (-90 to 90 deg South to North)
- Units: deg
- longitude
- Type: numeric
- Label: longitude
- Description: longitude of location where sampled (-180 to 180 West to East)
- Units: deg
- vegetation
- Type: character
- Label: vegetation
- Description: vegetation type where sampled if grown in field (leave blank for plantations / glasshouse / common garden): Sav = Savannah; TropRF = Tropical rainforest; TempRF = Temperate rainforest; TropSF = Tropical seasonal forest; TempF = Temperate forest; BorF = Boreal forest; Wo = Woodland; Gr = Grassland; Sh = Shrubland; De = Desert
- Units: NA
- map
- Type: numeric
- Label: map
- Description: mean annual rainfall (wild grown plants only)
- Units: mm
- mat
- Type: numeric
- Label: mat
- Description: mean annual temperature (wild grown plants only)
- Units: deg
- grouping
- Type: character
- Label: grouping
- Description: any information about growing environment of sampled plant such as treatment or subplot
- Units: NA
- lai
- Type: numeric
- Label: lai
- Description: leaf area index of vegetation (wild plants only)
- Units: m2 m-2
- species
- Type: character
- Label: species
- Description: latin name of species (genus species)
- Units: NA
- family
- Type: character
- Label: family
- Description: family
- Units: NA
- pft
- Type: character
- Label: pft
- Description: plant functional type: EA = evergreen angiosperm; DA = deciduous angiosperm; EG = evergreen gymnosperm; DG = deciduous gymnosperm
- Units: NA
- growingCondition
- Type: character
- Label: growing environment
- Description: growing environment of sampled plant: FW = field wild; FE =field experimental; GH = glasshouse; PU = plantation unmanaged; PM = plantation managed; GC = growth chamber; CG = common garden
- Units: NA
- status
- Type: character
- Label: crown status
- Description: position in forest canopy (wild grown plants only): 0 = supressed; 1 = intermediate; 2 = codominant (crown partly exposed); 3 = dominant (crown fully exposed)
- Units: NA
- light
- Type: character
- Label: light environment
- Description: note any information about light environment of sampled plant; we will determine appropriate categories once we see what information is available
- Units: NA
- age
- Type: numeric
- Label: age
- Description: age of plant expressed as decimal -> e.g. 3months = 0.25years
- Units: yr
- a.lf
- Type: numeric
- Label: leaf area
- Description: leaf area of whole plant
- Units: m2
- a.ssba
- Type: numeric
- Label: sapwood area at base
- Description: area of sapwood cross section at base
- Units: m2
- a.ssbh
- Type: numeric
- Label: sapwood area at breast height
- Description: area of sapwood cross section at breast height
- Units: m2
- a.ssbc
- Type: numeric
- Label: sapwood area at crown base
- Description: area of sapwood cross section at base of crown
- Units: m2
- a.shba
- Type: numeric
- Label: heartwood area at base
- Description: area of heartwood cross section at base
- Units: m2
- a.shbh
- Type: numeric
- Label: heartwood area at breast height
- Description: area of heartwood cross section at breast height
- Units: m2
- a.shbc
- Type: numeric
- Label: heartwood area at crown base
- Description: area of heartwood cross section at base of crown
- Units: m2
- a.sbba
- Type: numeric
- Label: bark area at base
- Description: area of bark cross section at base
- Units: m2
- a.sbbh
- Type: numeric
- Label: bark area at breast height
- Description: area of bark cross section at breast height
- Units: m2
- a.sbbc
- Type: numeric
- Label: bark area at crown base
- Description: area of bark cross section at base of crown
- Units: m2
- a.stba
- Type: numeric
- Label: stem area at base
- Description: area of total stem cross-section at base of the plant
- Units: m2
- a.stbh
- Type: numeric
- Label: stem area at breast height
- Description: area of total stem cross-section at breast height
- Units: m2
- a.stbc
- Type: numeric
- Label: stem area at crown base
- Description: area of total stem cross-section at base of the crown
- Units: m2
- a.cp
- Type: numeric
- Label: crown area
- Description: projected crown area as seen from above
- Units: m2
- a.cs
- Type: numeric
- Label: crown surface area
- Description: surface area of whole crown
- Units: m2
- h.t
- Type: numeric
- Label: height
- Description: total height of plant from ground to highest leaf
- Units: m
- h.c
- Type: numeric
- Label: height to crown base
- Description: height to crown base
- Units: m
- d.ba
- Type: numeric
- Label: basal diameter
- Description: diameter of stem at base
- Units: m
- d.bh
- Type: numeric
- Label: dbh
- Description: diameter of stem at breast height
- Units: m
- h.bh
- Type: numeric
- Label: height of d.bh measurement
- Description: height at which diameter at breast height (d.bh) is measured
- Units: m
- d.cr
- Type: numeric
- Label: crown width
- Description: diameter or width of crown
- Units: m
- c.d
- Type: numeric
- Label: crown depth
- Description: crown depth
- Units: m
- m.lf
- Type: numeric
- Label: leaf mass
- Description: leaf mass
- Units: kg
- m.ss
- Type: numeric
- Label: sapwood mass
- Description: sapwood mass including branches
- Units: kg
- m.sh
- Type: numeric
- Label: heartwood mass
- Description: heartwood mass including branches
- Units: kg
- m.sb
- Type: numeric
- Label: bark mass
- Description: bark mass including branches
- Units: kg
- m.st
- Type: numeric
- Label: total stem mass
- Description: mass of all stem tissue including branches (=m.ss + m.sh + m.sb)
- Units: kg
- m.so
- Type: numeric
- Label: aboveground mass
- Description: mass of all above-ground structures (=m.lf + m.st)
- Units: kg
- m.br
- Type: numeric
- Label: branch mass
- Description: branch mass
- Units: kg
- m.rf
- Type: numeric
- Label: fine root mass
- Description: fine root mass
- Units: kg
- m.rc
- Type: numeric
- Label: coarse root mass
- Description: coarse root mass
- Units: kg
- m.rt
- Type: numeric
- Label: total root mass
- Description: total root mass (=m.rf+m.rc)
- Units: kg
- m.to
- Type: numeric
- Label: total mass
- Description: total mass (=m.rt+m.so)
- Units: kg
- a.ilf
- Type: numeric
- Label: area of individual leaf
- Description: leaf size (average area of individual leaves across entire plant)
- Units: m2
- ma.ilf
- Type: numeric
- Label: leaf mass per area
- Description: leaf mass per area (average across entire plant or sample taken from top of plant; = m.lf/a.lf)
- Units: kg m-2
- r.st
- Type: numeric
- Label: wood density
- Description: average density of all stem tissue (wood density)
- Units: kg m-3
- r.ss
- Type: numeric
- Label: sapwood density
- Description: density of stem sapwood
- Units: kg m-3
- r.sb
- Type: numeric
- Label: bark density
- Description: density of stem bark
- Units: kg m-3
- r.sh
- Type: numeric
- Label: heartwood density
- Description: density of stem heartwood
- Units: kg m-3
- n.lf
- Type: numeric
- Label: leaf [nitrogen]
- Description: leaf nitrogen (average across entire plant or sample taken from top of plant)
- Units: kg kg-1
- n.ss
- Type: numeric
- Label: sapwood [nitrogen]
- Description: nitrogen content of sapwood
- Units: kg kg-1
- n.sb
- Type: numeric
- Label: bark [nitrogen]
- Description: nitrogen content of bark
- Units: kg kg-1
- n.sh
- Type: numeric
- Label: heartwood [nitrogen]
- Description: nitrogen content of heartwood
- Units: kg kg-1
- n.rf
- Type: numeric
- Label: fine root [nitrogen]
- Description: nitrogen content of fine roots
- Units: kg kg-1
- n.rc
- Type: numeric
- Label: coarse root [nitrogen]
- Description: nitrogen content of coarse roots
- Units: kg kg-1
Number of observations by variable
latitude |
Latitude |
deg |
21021 |
175 |
-52 |
10 |
62 |
longitude |
Longitude |
deg |
21021 |
175 |
-126 |
-66 |
175 |
age |
Age |
yr |
7074 |
73 |
0.17 |
13 |
1847 |
a.lf |
Leaf area |
m2 |
13846 |
108 |
0.000018 |
0.047 |
6018 |
a.ssba |
Sapwood area at base |
m2 |
168 |
5 |
0.000015 |
0.0012 |
0.088 |
a.ssbh |
Sapwood area at breast height |
m2 |
1475 |
16 |
0.00000018 |
0.0044 |
0.67 |
a.ssbc |
Sapwood area at crown base |
m2 |
277 |
7 |
0.00016 |
0.011 |
0.19 |
a.shba |
Heartwood area at base |
m2 |
24 |
1 |
0 |
0.006 |
0.28 |
a.shbh |
Heartwood area at breast height |
m2 |
421 |
4 |
0 |
0.00075 |
0.2 |
a.shbc |
Heartwood area at crown base |
m2 |
36 |
1 |
0 |
0.00036 |
0.0068 |
a.sbbh |
Bark area at breast height |
m2 |
141 |
1 |
0.000059 |
0.0014 |
0.0063 |
a.stba |
Stem area at base |
m2 |
9704 |
56 |
0.0000000038 |
0.000026 |
1.5 |
a.stbh |
Stem area at breast height |
m2 |
8626 |
129 |
0.00000079 |
0.0068 |
33 |
a.stbc |
Stem area at crown base |
m2 |
1325 |
18 |
0.000000006 |
0.000012 |
0.13 |
a.cp |
Crown area |
m2 |
7414 |
55 |
0.0002 |
0.63 |
1257 |
a.cs |
Crown surface area |
m2 |
1187 |
9 |
0.00047 |
0.086 |
652 |
h.t |
Height |
m |
19586 |
169 |
0.004 |
1.2 |
113 |
h.c |
Height to crown base |
m |
10214 |
90 |
0 |
0.77 |
40 |
d.ba |
Basal diameter |
m |
9704 |
56 |
0.00007 |
0.0058 |
1.4 |
d.bh |
Dbh |
m |
8626 |
129 |
0.001 |
0.093 |
6.5 |
h.bh |
Height of d.bh measurement |
m |
10114 |
128 |
0.03 |
1.3 |
4.8 |
d.cr |
Crown width |
m |
7414 |
55 |
0.014 |
0.88 |
40 |
c.d |
Crown depth |
m |
9551 |
89 |
0 |
1.7 |
41 |
m.lf |
Leaf mass |
kg |
17069 |
163 |
0.0000002 |
0.0057 |
992 |
m.ss |
Sapwood mass |
kg |
239 |
4 |
0.021 |
31 |
2089 |
m.sh |
Heartwood mass |
kg |
212 |
3 |
0 |
3.4 |
1759 |
m.sb |
Bark mass |
kg |
1323 |
13 |
0.00008 |
5.4 |
1236 |
m.st |
Total stem mass |
kg |
14421 |
138 |
0.0000001 |
0.0038 |
322566 |
m.so |
Aboveground mass |
kg |
14972 |
143 |
0.0000008 |
0.011 |
323200 |
m.br |
Branch mass |
kg |
6552 |
114 |
0 |
0.86 |
9586 |
m.rf |
Fine root mass |
kg |
1672 |
16 |
0.000001 |
0.00019 |
20 |
m.rc |
Coarse root mass |
kg |
2095 |
20 |
0 |
0.0011 |
459 |
m.rt |
Total root mass |
kg |
9061 |
68 |
0.0000001 |
0.00065 |
505 |
m.to |
Total mass |
kg |
8878 |
70 |
0.000001 |
0.002 |
7410 |
a.ilf |
Area of individual leaf |
m2 |
5898 |
26 |
0.0000011 |
0.0025 |
0.19 |
ma.ilf |
Leaf mass per area |
kg m-2 |
9225 |
37 |
0.0015 |
0.045 |
0.81 |
r.st |
Wood density |
kg m-3 |
3529 |
12 |
61 |
410 |
1603 |
r.ss |
Sapwood density |
kg m-3 |
53 |
1 |
300 |
410 |
590 |
r.sh |
Heartwood density |
kg m-3 |
53 |
1 |
310 |
370 |
500 |
n.lf |
Leaf [nitrogen] |
kg kg-1 |
1303 |
11 |
0.0044 |
0.023 |
0.045 |
n.ss |
Sapwood [nitrogen] |
kg kg-1 |
425 |
7 |
0 |
0.0016 |
0.0082 |
n.sb |
Bark [nitrogen] |
kg kg-1 |
261 |
3 |
0.0021 |
0.0037 |
0.011 |
n.sh |
Heartwood [nitrogen] |
kg kg-1 |
143 |
2 |
0 |
0.00094 |
0.0029 |
n.rf |
Fine root [nitrogen] |
kg kg-1 |
148 |
5 |
0 |
0.0047 |
0.0083 |
n.rc |
Coarse root [nitrogen] |
kg kg-1 |
207 |
6 |
0 |
0.003 |
0.01 |
ACKNOWLEDGMENTS
Compilers: D.S. Falster, A. Vårhammer and D.R. Barneche were employed on an ARC discovery grant to Falster (DP110102086) and a UWS start-up grant to R.A. Duursma. R.G. FitzJohn was supported by the Science and Industry Endowment Fund (RP04-174). M.I. Ishihara was supported by the Environmental Research and Technology Development Fund (S-9-3) of the Ministry of the Environment, Japan. We thank Takahiro Inoue, Hayato Aoyama and Shin-ichiro Aiba for valuable assistance.
In addition, we thank the following people for contributions to the following studies: Aiba2005: Forest Department of Sarawak and Sarawak Forest Research Corporation for their kind permission to conduct research in Lambir Hills National Park. This study was partly supported by a Research Fellowship for Young Scientists (to M. Aiba) and grants from the Ministry of Environment (No. S-9-3 to M. Aiba); Aiba2007: Forest Department of Sarawak and Sarawak Forest Research Corporation for their kind permission to conduct research in Lambir Hills National Park. This study was partly supported by a Research Fellowship for Young Scientists (to M. Aiba) and grants from the Ministry of Environment (No. S-9-3 to M. Aiba); Baraloto2006: This work has benefited from an Investissements dAvenir grant managed by Agence Nationale de la Recherche (CEBA, ref. ANR-10-LABX-25-01); BondLamberty2002: B.B.-L. was supported by the Terrestrial Ecology program of the DOE Office of Science; Coll2008: J. Monteza for supervising and motivating the team of workers digging roots in the wet, clay rich soils of Sardinilla, Panama; Domec2012: This work was funded by the Department of Energy TES Program and by Department of Agriculture AFRI-NIFA program; Fatemi2011: The National Science Foundation (DEB 0235650) and the Edna Bailey Sussman Foundation.; Kenzo2009: T. Itioka; Kenzo2009b: I. Ninomiya, K. Sakurai, J. J. Kendawang and D. Hattori; leMaire2011: C. Marsden (SupAgro, Eco&Sols, Montpellier, France); McCulloh2010: K. A. M. wishes to thank L. Bernart, C. Berthier, B. Becker, J. C. Domec, P. Gourdon and S. L. Voelker for assistance with data collection and NSF grant IOS 05-44470 and DEB 0080382 for financial assistance; Osunkoya2007: P. Becker initially set up the permanent plots used; Portsmuth2005: Estonian Science Foundation (grant 5702) and the Estonian Ministry of Education and Science (grant 0182468As03); Portsmuth2006: Estonian Science Foundation (grant 5702) and the Estonian Ministry of Education and Science (grant 0182468As03), the Estonian Academy of Sciences, and the Estonian National Culture Foundation; vanBreugel2011: Y. Guerrero, J. Balbuena, M. Nuñez, G. Fernandez, F. Garcia, C. Diaz, A. Rivas and G. Sala for their help in data collection; Vanninen2005: H. Ylitalo, H. Mäkinen and R. Sievänen; Whittaker1974: T. Siccama took the lead in documenting the original data so they could eventually be shared; Yamada1996: E. Suzuki; Yamada2000: E. Suzuki .
LITERATURE CITED
[1] Cannell, M. G. R., and R. C. Dewar. Carbon allocation in trees: a review of concepts for modelling. In: Advances in Ecological Research 25 (1994), pp. 59–104.
[2] Niklas, K. J. Plant allometry: the scaling of form and process. Chicago: The University of Chicago Press, 1994. ISBN: 0-226-58081-4.
[3] Michener, W. K., J. W. Brunt, J. J. Helly, et al. NONGEOSPATIAL METADATA FOR THE ECOLOGICAL SCIENCES. In: Ecological Applications 7.1 (Feb. 1997), pp. 330–342. DOI: 10.1890/1051-0761(1997)007[0330:nmftes]2.0.co;2.
[4] Ter-Mikaelian, M. T., and M. D. Korzukhin. Biomass equations for sixty-five North American tree species. In: Forest Ecology and Management 97.1 (Sep. 1997), pp. 1–24. DOI: 10.1016/s0378-1127(97)00019-4.
[5] Jenkins, J., D. Chojnacky, L. Heath, et al. National-scale biomass estimators for United States tree species. In: Forest Science 49.1 (Feb. 2003), pp. 12–35.
[6] Chave, J., C. Andalo, S. Brown, et al. Tree allometry and improved estimation of carbon stocks and balance in tropical forests. En. In: Oecologia 145.1 (Aug. 2005), pp. 87–99. DOI: 10.1007/s00442-005-0100-x. (visited on 01/22/2014).
[7] Zianis, D., P. Muukkonen, R. Mäkipää, et al. Biomass and stem volume equations for tree species in Europe. In: Silva Fennica Monographs 4 (2005), p. 63.
[8] Litton, C. M., J. W. Raich and M. G. Ryan. Carbon allocation in forest ecosystems. In: Global Change Biology 13 (Oct. 2007). 10, pp. 2089–2109. DOI: 10.1111/j.1365-2486.2007.01420.x.
[9] Falster, D. S. . Brännström, U. Dieckmann, et al. Influence of four major plant traits on average height, leaf-area cover, net primary productivity, and biomass density in single-species forests: a theoretical investigation. In: Journal of Ecology 99.1 (Oct. 2010), pp. 148–164. DOI: 10.1111/j.1365-2745.2010.01735.x.
[10] Cayuela, L., Ì. G. la Cerda, F. S. Albuquerque, et al. taxonstand: An r package for species names standardisation in vegetation databases. In: Methods Ecol Evol 3.6 (Jul. 2012), pp. 1078–1083. DOI: 10.1111/j.2041-210x.2012.00232.x.
[11] Michener, W. K., and M. B. Jones. Ecoinformatics: supporting ecology as a data-intensive science. In: Trends in Ecology & Evolution 27.2 (Feb. 2012), pp. 85–93. DOI: 10.1016/j.tree.2011.11.016.
[12] Poorter, H., K. J. Niklas, P. B. Reich, et al. Biomass allocation to leaves, stems and roots: meta-analyses of interspecific variation and environmental control. En. In: New Phytologist 193.1 (2012), p. 30–50. DOI: 10.1111/j.1469-8137.2011.03952.x. (visited on 03/03/2014).
[13] Chamberlain, S. A., and E. Szöcs. Taxize: taxonomic search and retrieval in R. In: F1000Research 2 (2013), p. 191. DOI: 10.12688/f1000research.2-191.v2.
[14] Costello, M. J., W. K. Michener, M. Gahegan, et al. Biodiversity data should be published, cited, and peer reviewed. In: Trends in Ecology & Evolution 28.8 (Aug. 2013), pp. 454–461. DOI: 10.1016/j.tree.2013.05.002.
[15] Henry, M., A. Bombelli, C. Trotta, et al. GlobAllomeTree: international platform for tree allometric equations to support volume, biomass and carbon assessment. In: iForest 6.5 (2013), pp. 326–330. DOI: 10.3832/ifor0901-006.
[16] Noorden, R. V. Data-sharing: Everything on display. In: njobs 500.7461 (Aug. 2013), pp. 243–245. DOI: 10.1038/nj7461-243a.
[17] Xie, Y. Dynamic Documents with R and knitr. ISBN 978-1482203530. Boca Raton, Florida: Chapman and Hall/CRC, 2013.
[18] Fady, B., A. Benard, C. Pichot, et al. The open data debate: a need for accessible and shared data in forest science. In: Annals of Forest Science 71.5 (May. 2014), pp. 523–525. DOI: 10.1007/s13595-014-0375-3.
[19] Harfoot, M., and D. Roberts. Taxonomy: Call for ecosystem modelling data. In: Nature 505.7482 (Jan. 2014), pp. 160–160. DOI: 10.1038/505160a.
[20] Kratz, J., and C. Strasser. Data publication consensus and controversies. In: F1000Research (May. 2014). DOI: 10.12688/f1000research.4518.
[21] Xie, Y. knitr: A Comprehensive Tool for Reproducible Research in R. In: Implementing Reproducible Computational Research. Ed. by V. Stodden, F. Leisch and R. D. Peng. ISBN 978-1466561595. Chapman and Hall/CRC, 2014.
[22] Xie, Y. knitr: A General-Purpose Package for Dynamic Report Generation in R. R package version 1.8. 2014.
[23] Ishihara, M. I., H. Utsugi, H. Tanouchi, et al. Efficacy of generic allometric equations for estimating biomass: a test in Japanese natural forests. In: Ecological Applications (2015), p. In press.
[Back to E096-128]